
 Yahoo Finance
 Are Interma Trade S.A.'s (WSE:ITM) Interest Costs Too High?

Interma Trade S.A. (WSE:ITM) is a small-cap stock with a market capitalization of zł15m. While investors primarily focus on the growth potential and competitive landscape of the small-cap companies, they end up ignoring a key aspect, which could be the biggest threat to its existence: its financial health. Why is it important? Given that ITM is not presently profitable, it’s essential to evaluate the current state of its operations and pathway to profitability. The following basic checks can help you get a picture of the company's balance sheet strength. Nevertheless, these checks don't give you a full picture, so I suggest you dig deeper yourself into ITM here.
Want to participate in a short research study? Help shape the future of investing tools and you could win a $250 gift card!
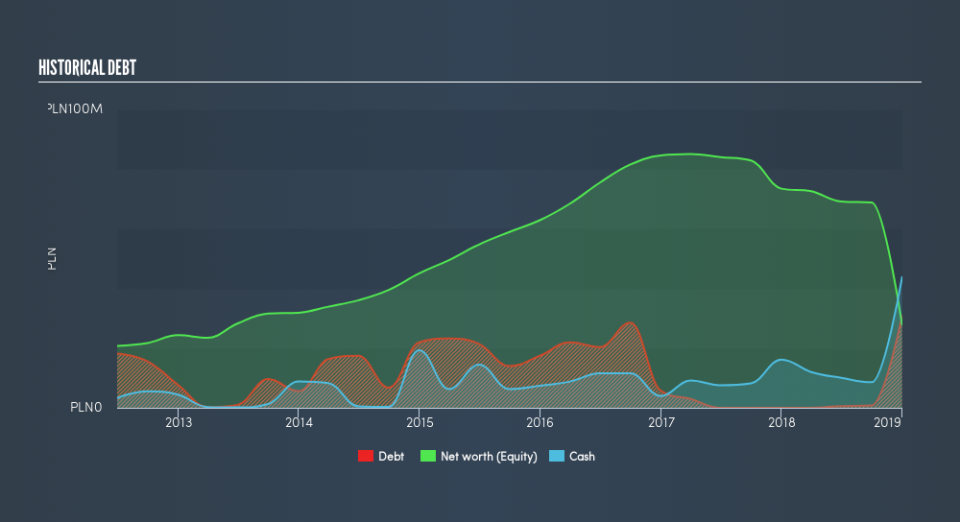
ITM’s Debt (And Cash Flows)
Over the past year, ITM has borrowed debt capital of around zł31m , which is mainly comprised of near term debt. With this ramp up in debt, ITM currently has zł44m remaining in cash and short-term investments , ready to be used for running the business. Additionally, ITM has produced cash from operations of zł1.5m in the last twelve months, resulting in an operating cash to total debt ratio of 4.9%, meaning that ITM’s operating cash is less than its debt.
Can ITM pay its short-term liabilities?
Looking at ITM’s zł98m in current liabilities, it appears that the company has maintained a safe level of current assets to meet its obligations, with the current ratio last standing at 1.08x. The current ratio is calculated by dividing current assets by current liabilities. Generally, for Luxury companies, this is a reasonable ratio as there's enough of a cash buffer without holding too much capital in low return investments.
Does ITM face the risk of succumbing to its debt-load?
With total debt exceeding equity, ITM is considered a highly levered company. This is somewhat unusual for small-caps companies, since lenders are often hesitant to provide attractive interest rates to less-established businesses. Though, since ITM is currently loss-making, there’s a question of sustainability of its current operations. Maintaining a high level of debt, while revenues are still below costs, can be dangerous as liquidity tends to dry up in unexpected downturns.
Next Steps:
Although ITM’s debt level is towards the higher end of the spectrum, its cash flow coverage seems adequate to meet obligations which means its debt is being efficiently utilised. This may mean this is an optimal capital structure for the business, given that it is also meeting its short-term commitment. This is only a rough assessment of financial health, and I'm sure ITM has company-specific issues impacting its capital structure decisions. You should continue to research Interma Trade to get a better picture of the small-cap by looking at:
Future Outlook: What are well-informed industry analysts predicting for ITM’s future growth? Take a look at our free research report of analyst consensus for ITM’s outlook.
Historical Performance: What has ITM's returns been like over the past? Go into more detail in the past track record analysis and take a look at the free visual representations of our analysis for more clarity.
Other High-Performing Stocks: Are there other stocks that provide better prospects with proven track records? Explore our free list of these great stocks here.
We aim to bring you long-term focused research analysis driven by fundamental data. Note that our analysis may not factor in the latest price-sensitive company announcements or qualitative material.
If you spot an error that warrants correction, please contact the editor at editorial-team@simplywallst.com. This article by Simply Wall St is general in nature. It does not constitute a recommendation to buy or sell any stock, and does not take account of your objectives, or your financial situation. Simply Wall St has no position in the stocks mentioned. Thank you for reading.
