
 Yahoo Finance
 Interested In GUD Holdings Limited (ASX:GUD)? Here’s What Its Recent Performance Looks Like

Assessing GUD Holdings Limited’s (ASX:GUD) past track record of performance is a valuable exercise for investors. It enables us to reflect on whether the company has met or exceed expectations, which is a great indicator for future performance. Today I will assess GUD’s recent performance announced on 31 December 2017 and evaluate these figures to its longer term trend and industry movements. View out our latest analysis for GUD Holdings
How Did GUD’s Recent Performance Stack Up Against Its Past?
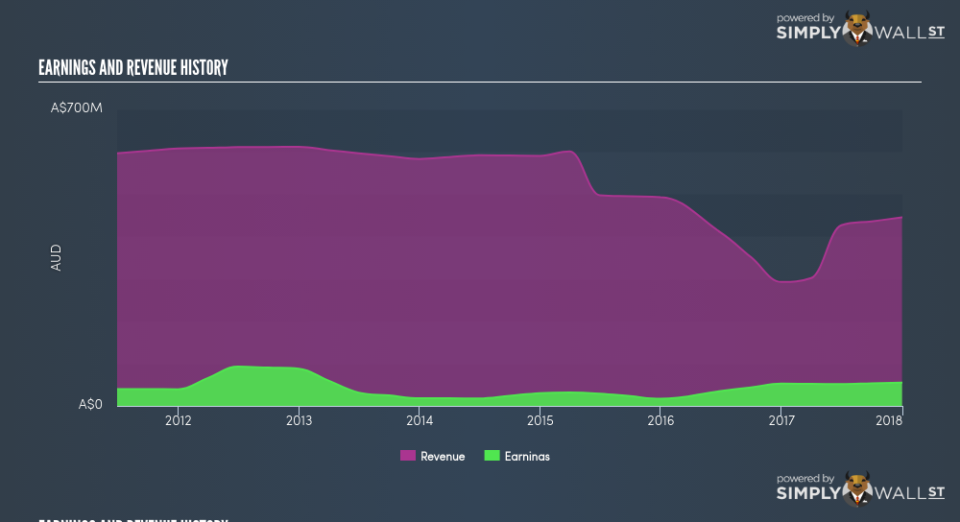
GUD’s trailing twelve-month earnings (from 31 December 2017) of AU$55.13m has increased by 5.09% compared to the previous year. Furthermore, this one-year growth rate has exceeded its 5-year annual growth average of -4.91%, indicating the rate at which GUD is growing has accelerated. What’s enabled this growth? Let’s take a look at whether it is only attributable to an industry uplift, or if GUD Holdings has seen some company-specific growth.
In the past few years, although bottom-line growth has seen a decrease, top-line growth has fallen by a lot more, leading to a margin expansion and GUD Holdings still maintaining profitability. Viewing growth from a sector-level, the Australian auto components industry has been growing its average earnings by double-digit 11.87% over the past year, and 11.60% over the past half a decade. This means that any uplift the industry is enjoying, GUD Holdings has not been able to reap as much as its industry peers.
In terms of returns from investment, GUD Holdings has invested its equity funds well leading to a 26.31% return on equity (ROE), above the sensible minimum of 20%. Furthermore, its return on assets (ROA) of 12.72% exceeds the AU Auto Components industry of 6.92%, indicating GUD Holdings has used its assets more efficiently. And finally, its return on capital (ROC), which also accounts for GUD Holdings’s debt level, has increased over the past 3 years from 12.25% to 19.17%.
What does this mean?
GUD Holdings’s track record can be a valuable insight into its earnings performance, but it certainly doesn’t tell the whole story. Companies that have performed well in the past, such as GUD Holdings gives investors conviction. However, the next step would be to assess whether the future looks as optimistic. I recommend you continue to research GUD Holdings to get a better picture of the stock by looking at:
Future Outlook: What are well-informed industry analysts predicting for GUD’s future growth? Take a look at our free research report of analyst consensus for GUD’s outlook.
Financial Health: Is GUD’s operations financially sustainable? Balance sheets can be hard to analyze, which is why we’ve done it for you. Check out our financial health checks here.
Other High-Performing Stocks: Are there other stocks that provide better prospects with proven track records? Explore our free list of these great stocks here.
NB: Figures in this article are calculated using data from the trailing twelve months from 31 December 2017. This may not be consistent with full year annual report figures.
To help readers see pass the short term volatility of the financial market, we aim to bring you a long-term focused research analysis purely driven by fundamental data. Note that our analysis does not factor in the latest price sensitive company announcements.
The author is an independent contributor and at the time of publication had no position in the stocks mentioned.
