
 Yahoo Finance
 Intelsat (I) Q3 Loss Wider Than Expected, Revenues Down Y/Y
Intelsat S.A. I reported lackluster third-quarter 2019 results, wherein the top line decreased year over year. Despite the soft quarterly performance, the company’s share price increased 1.18% in yesterday’s trading session following the results to eventually close at $26.52, probably driven by an unchanged outlook for the year.
Net Loss
On GAAP basis, net loss for the reported quarter was $148.3 million or loss of $1.05 per share compared with loss of $374.6 million or loss of $2.74 per share in the prior-year quarter. The narrower loss was mainly due to the absence of loss on early extinguishment of debt (amounting to $204.1 million), which was recorded in the prior-year quarter. Adjusted net loss per share was $1.05, which was wider than the Zacks Consensus Estimate of loss of $1.
Intelsat S.A. Price, Consensus and EPS Surprise
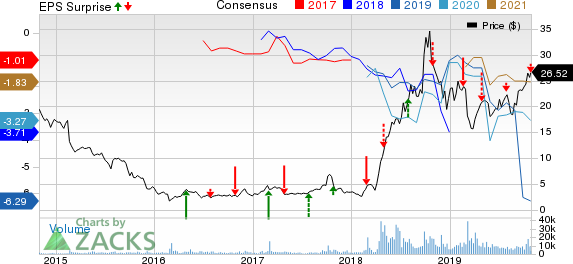
Intelsat S.A. price-consensus-eps-surprise-chart | Intelsat S.A. Quote
Revenues
Quarterly revenues declined 6% to $506.7 million from $536.9 million in the year-ago quarter. The top line, however, surpassed the Zacks Consensus Estimate of $503 million.
By type of service, total on-network revenues declined 6.6% to $458 million from $490.5 million in the year-earlier quarter mainly due to lower transponder and managed services. Total off-network and other revenues grew to $48.7 million from $46.4 million reported a year ago, up 4.8%. This increase was primarily driven by the higher aggregate revenues in Transponder, MSS and other Off-Network services and Satellite-related services.
By customer application, revenues from network services, media, government and other services were $180.8 million, $222.9 million, $95.7 million and $7.3 million, respectively, compared with $199 million, $233.1 million, $98.4 million and $6.5 million in the third quarter of 2018.
Other Details
Total operating expenses were $327 million compared with $299.7 million in the prior-year quarter due to higher direct costs of revenues and SG&A expenses. Operating income was $179.6 million compared with $237.3 million in the year-ago quarter. Adjusted EBITDA decreased by $60 million to $356.1 million or 70% of revenues from $416.3 million or 78% of revenues in the year-ago quarter. The lower adjusted EBITDA majorly reflects increased direct costs of revenues, off-network satellite expenses related to customer restoration services for the loss of Intelsat 29e satellite in April 2019, bad debt expenses of $9 million in Europe and burgeoning staff and operations costs.
Intelsat’s average fill rate on its approximately 1,750 36 MHz station-kept wide-beam transponders was 80% on Sep 30, 2019 compared with 78% on Jun 30, 2019. The increase in fill rate was mainly driven by the launch of Intelsat FlexGround managed services to address critical communications restoration efforts by providing high performance, rapid deployment and flexibility for ‘comms on the pause’ applications. In addition, the high-throughput satellite Intelsat EpicNG unit count was approximately 1,200 units in service, unchanged from the prior-quarter end.
The company currently has five satellites covered by its 2019-2021 capital expenditure plan, one of which has already been launched on Aug 6, 2019 and another is in the phase of design and manufacturing. The remaining three satellites are replacement spacecraft, for which manufacturing contracts have not yet been signed.
Cash Flow & Liquidity
Intelsat generated $29.9 million of net cash from operating activities compared with $36.1 million in the year-ago quarter. Free cash flow used in operations were $10.1 million compared with $15.7 million a year ago. As of Sep 30, 2019, the company had $802.4 million in cash and cash equivalents with $14,454.6 million of long-term debt.
Outlook Reiterated
Intelsat has reiterated its full-year 2019 revenue and adjusted EBITDA guidance. The company continues to expect revenues in the range of $2-$2.06 billion. It expects adjusted EBITDA between $1.43 billion and $1.48 billion.
Further, Intelsat affirmed its capital expenditure framework for 2019-2021 to be in the range of $250-$300 million, $275-$350 million and $250-$350 million, respectively. It stated that over the next several years, it is in a cycle of lower required investment, due to timing of replacement satellites and smaller satellites being built. It expects cash taxes to range from $30 million to $40 million annually.
Intelsat’s Galaxy 30 satellite is expected to be launched in the second quarter of 2020 for media and broadband services. The company also plans to expand FlexGround services, which include the Intelsat EpicNG high-throughput network and IntelsatOne, to address expected U.S. government demand for ‘comms on the move’ applications.
Intelsat’s 2019 operational priorities are expected to stabilize its core business, improve competitive position, return the company to growth and optimize asset value by leading the industry in seamless implementation of satellite-based telecommunications solutions coupled with global telecommunications infrastructure.
Zacks Rank & Stocks to Consider
Intelsat currently has a Zacks Rank #4 (Sell).
A few better-ranked stocks in the broader industry are Altice USA, Inc. ATUS, Harmonic Inc. HLIT and UTStarcom Holdings Corp. UTSI, each carrying a Zacks Rank #2 (Buy). You can see the complete list of today’s Zacks #1 Rank (Strong Buy) stocks here.
Altice delivered average positive earnings surprise of 158.5% in the trailing four quarters.
Harmonic pulled off average positive earnings surprise of 48.3% in the trailing four quarters.
UTStarcom Holdings delivered average positive earnings surprise of 56.4% in the trailing four quarters, beating estimates twice.
Today's Best Stocks from Zacks
Would you like to see the updated picks from our best market-beating strategies? From 2017 through 2018, while the S&P 500 gained +15.8%, five of our screens returned +38.0%, +61.3%, +61.6%, +68.1%, and +98.3%.
This outperformance has not just been a recent phenomenon. From 2000 – 2018, while the S&P averaged +4.8% per year, our top strategies averaged up to +56.2% per year.
See their latest picks free >>
Want the latest recommendations from Zacks Investment Research? Today, you can download 7 Best Stocks for the Next 30 Days. Click to get this free report
Harmonic Inc. (HLIT) : Free Stock Analysis Report
UTStarcom Holdings Corp (UTSI) : Free Stock Analysis Report
Intelsat S.A. (I) : Free Stock Analysis Report
Altice USA, Inc. (ATUS) : Free Stock Analysis Report
To read this article on Zacks.com click here.
Zacks Investment Research
