
 Yahoo Finance
 Instructure Holdings (NYSE:INST) Might Have The Makings Of A Multi-Bagger
Finding a business that has the potential to grow substantially is not easy, but it is possible if we look at a few key financial metrics. One common approach is to try and find a company with returns on capital employed (ROCE) that are increasing, in conjunction with a growing amount of capital employed. Basically this means that a company has profitable initiatives that it can continue to reinvest in, which is a trait of a compounding machine. Speaking of which, we noticed some great changes in Instructure Holdings' (NYSE:INST) returns on capital, so let's have a look.
Return On Capital Employed (ROCE): What Is It?
For those who don't know, ROCE is a measure of a company's yearly pre-tax profit (its return), relative to the capital employed in the business. The formula for this calculation on Instructure Holdings is:
Return on Capital Employed = Earnings Before Interest and Tax (EBIT) ÷ (Total Assets - Current Liabilities)
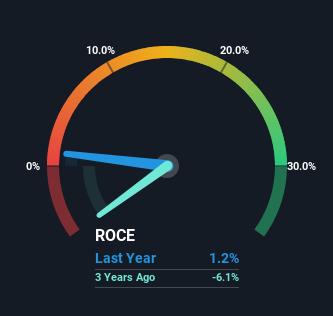
0.012 = US$29m ÷ (US$2.8b - US$288m) (Based on the trailing twelve months to March 2024).
Thus, Instructure Holdings has an ROCE of 1.2%. Ultimately, that's a low return and it under-performs the Software industry average of 7.5%.
Check out our latest analysis for Instructure Holdings
In the above chart we have measured Instructure Holdings' prior ROCE against its prior performance, but the future is arguably more important. If you'd like to see what analysts are forecasting going forward, you should check out our free analyst report for Instructure Holdings .
What Does the ROCE Trend For Instructure Holdings Tell Us?
The fact that Instructure Holdings is now generating some pre-tax profits from its prior investments is very encouraging. Shareholders would no doubt be pleased with this because the business was loss-making five years ago but is is now generating 1.2% on its capital. Not only that, but the company is utilizing 1,195% more capital than before, but that's to be expected from a company trying to break into profitability. This can tell us that the company has plenty of reinvestment opportunities that are able to generate higher returns.
On a related note, the company's ratio of current liabilities to total assets has decreased to 10%, which basically reduces it's funding from the likes of short-term creditors or suppliers. So shareholders would be pleased that the growth in returns has mostly come from underlying business performance.
The Key Takeaway
Overall, Instructure Holdings gets a big tick from us thanks in most part to the fact that it is now profitable and is reinvesting in its business. And given the stock has remained rather flat over the last year, there might be an opportunity here if other metrics are strong. That being the case, research into the company's current valuation metrics and future prospects seems fitting.
One more thing, we've spotted 1 warning sign facing Instructure Holdings that you might find interesting.
If you want to search for solid companies with great earnings, check out this free list of companies with good balance sheets and impressive returns on equity.
Have feedback on this article? Concerned about the content? Get in touch with us directly. Alternatively, email editorial-team (at) simplywallst.com.
This article by Simply Wall St is general in nature. We provide commentary based on historical data and analyst forecasts only using an unbiased methodology and our articles are not intended to be financial advice. It does not constitute a recommendation to buy or sell any stock, and does not take account of your objectives, or your financial situation. We aim to bring you long-term focused analysis driven by fundamental data. Note that our analysis may not factor in the latest price-sensitive company announcements or qualitative material. Simply Wall St has no position in any stocks mentioned.
Have feedback on this article? Concerned about the content? Get in touch with us directly. Alternatively, email editorial-team@simplywallst.com
