
 Yahoo Finance
 Instone Real Estate Group (ETR:INS) investors are sitting on a loss of 63% if they invested three years ago
Investing in stocks inevitably means buying into some companies that perform poorly. Long term Instone Real Estate Group SE (ETR:INS) shareholders know that all too well, since the share price is down considerably over three years. Unfortunately, they have held through a 67% decline in the share price in that time.
Now let's have a look at the company's fundamentals, and see if the long term shareholder return has matched the performance of the underlying business.
Check out our latest analysis for Instone Real Estate Group
To quote Buffett, 'Ships will sail around the world but the Flat Earth Society will flourish. There will continue to be wide discrepancies between price and value in the marketplace...' One imperfect but simple way to consider how the market perception of a company has shifted is to compare the change in the earnings per share (EPS) with the share price movement.
Instone Real Estate Group saw its EPS decline at a compound rate of 15% per year, over the last three years. This reduction in EPS is slower than the 31% annual reduction in the share price. So it seems the market was too confident about the business, in the past. This increased caution is also evident in the rather low P/E ratio, which is sitting at 8.49.
The image below shows how EPS has tracked over time (if you click on the image you can see greater detail).
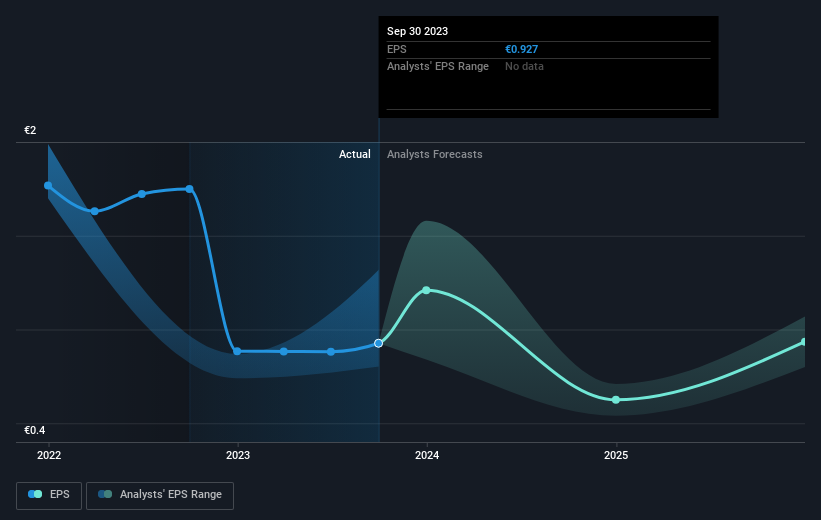
Dive deeper into Instone Real Estate Group's key metrics by checking this interactive graph of Instone Real Estate Group's earnings, revenue and cash flow.
What About Dividends?
It is important to consider the total shareholder return, as well as the share price return, for any given stock. Whereas the share price return only reflects the change in the share price, the TSR includes the value of dividends (assuming they were reinvested) and the benefit of any discounted capital raising or spin-off. So for companies that pay a generous dividend, the TSR is often a lot higher than the share price return. As it happens, Instone Real Estate Group's TSR for the last 3 years was -63%, which exceeds the share price return mentioned earlier. And there's no prize for guessing that the dividend payments largely explain the divergence!
A Different Perspective
Instone Real Estate Group shareholders gained a total return of 5.4% during the year. Unfortunately this falls short of the market return. On the bright side, that's still a gain, and it is certainly better than the yearly loss of about 9% endured over half a decade. So this might be a sign the business has turned its fortunes around. I find it very interesting to look at share price over the long term as a proxy for business performance. But to truly gain insight, we need to consider other information, too. For instance, we've identified 3 warning signs for Instone Real Estate Group (2 can't be ignored) that you should be aware of.
For those who like to find winning investments this free list of growing companies with recent insider purchasing, could be just the ticket.
Please note, the market returns quoted in this article reflect the market weighted average returns of stocks that currently trade on German exchanges.
Have feedback on this article? Concerned about the content? Get in touch with us directly. Alternatively, email editorial-team (at) simplywallst.com.
This article by Simply Wall St is general in nature. We provide commentary based on historical data and analyst forecasts only using an unbiased methodology and our articles are not intended to be financial advice. It does not constitute a recommendation to buy or sell any stock, and does not take account of your objectives, or your financial situation. We aim to bring you long-term focused analysis driven by fundamental data. Note that our analysis may not factor in the latest price-sensitive company announcements or qualitative material. Simply Wall St has no position in any stocks mentioned.
