
 Yahoo Finance
 Insperity (NSP) Q3 Earnings Lag, Revenues Beat, View Down
Insperity, Inc. NSP reported mixed third-quarter 2019 results, wherein earnings lagged the Zacks Consensus Estimate but revenues surpassed the same.
Adjusted earnings of 75 cents per share missed the consensus mark by 25.7% and decreased 21.9% year over year due to elevated benefit costs. The reported figure is below the guided range of $1.00-$1.04.
Total revenues of $1.04 billion beat the consensus estimate by 0.8% and increased 12.8% year over year on the back of a 12% rise in average number of worksite employees (WSEEs) paid per month. Average number of worksite employees paid per month was 240,939 at the end of the reported quarter.
Insperity, Inc. Revenue (TTM)

Insperity, Inc. revenue-ttm | Insperity, Inc. Quote
Operating Results
Gross profit of $170.55 million increased 2.7% from the year-ago quarter. Gross margin of 16.3% declined from 17.9% in the year-ago quarter. Gross profit per worksite employee per month decreased 8.2% year over year to $236.
Adjusted EBITDA was down 16.9% year over year to $51.15 million. Adjusted EBITDA per worksite employee per month decreased 25.3% to $75.
Adjusted operating expenses increased 15.2% year over year to $135.81 million. Adjusted operating expenses per worksite employee per month increased 2.7% to $188.
Operating income decreased 27.8% year over year to $34.73 million. Operating income per worksite employee per month decreased 36% to $48.
Insperity, Inc. Price, Consensus and EPS Surprise
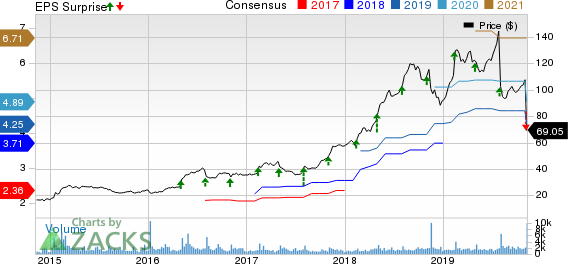
Insperity, Inc. price-consensus-eps-surprise-chart | Insperity, Inc. Quote
Balance Sheet & Cash Flow
Insperity exited third-quarter 2019 with adjusted cash, cash equivalents and marketable securities of $130.86 million compared with $130.66 million at the end of the prior quarter. Long-term debt amounted to $239.40 million compared with $169.40 million at the end of the previous quarter.
Q4 Guidance
For fourth-quarter 2019, Insperity projects adjusted earnings in the range of 50-61 cents per share. The midpoint of this guidance indicates a year-over-year decline of 19.6%. The current Zacks Consensus Estimate of 76 cents lies above the guided range.
Adjusted EBITDA is anticipated between $38 million and $44 million. The midpoint of this guidance indicates a year-over-year decline of 13.9%.
Average WSEEs is expected in the range of 244,000-246,200, indicating 10-11% growth.
2019 Guidance
For the full year, Insperity lowered its guidance for adjusted EPS, adjusted EBITDA and average WSEs.
The company now projects adjusted earnings in the band of $4.08-$4.20 per share (indicating growth of 9-12%) compared with the previously guided range of $4.59-$4.74 (which suggested growth of 22-26%). The current Zacks Consensus Estimate of $4.51 lies above the updated guidance.
Adjusted EBITDA is now anticipated to grow 3-6% to a range of $247-$253 million compared with the previously guided range of $278-$286 million (which indicated 16-19% growth).
Average WSEEs are expected to grow 12.7-13% to a range of 235,700-236,300 compared with the previously guided range of 237,350-239,500, indicating 13.5-14.5% growth.
Zacks Rank & Stocks to Consider
Currently, Insperity carries a Zacks Rank #5 (Strong Sell).
A few better-ranked stocks in the broader Zacks Business Services sector are Global Payments GPN, Mastercard MA and Cardtronics CATM. While Global Payments sports a Zacks Rank #1, Mastercard and Cardtronics carry a Zacks Rank #2 (Buy). You can see the complete list of today’s Zacks #1 Rank (Strong Buy) stocks here.
The long-term expected EPS (three to five years) growth rate for Global Payments, Mastercard and Cardtronics is 17%, 15.9% and 4%, respectively.
Today's Best Stocks from Zacks
Would you like to see the updated picks from our best market-beating strategies? From 2017 through 2018, while the S&P 500 gained +15.8%, five of our screens returned +38.0%, +61.3%, +61.6%, +68.1%, and +98.3%.
This outperformance has not just been a recent phenomenon. From 2000 – 2018, while the S&P averaged +4.8% per year, our top strategies averaged up to +56.2% per year.
See their latest picks free >>
Want the latest recommendations from Zacks Investment Research? Today, you can download 7 Best Stocks for the Next 30 Days. Click to get this free report
Cardtronics PLC (CATM) : Free Stock Analysis Report
Insperity, Inc. (NSP) : Free Stock Analysis Report
Mastercard Incorporated (MA) : Free Stock Analysis Report
Global Payments Inc. (GPN) : Free Stock Analysis Report
To read this article on Zacks.com click here.
Zacks Investment Research