
 Yahoo Finance
 INSPECS Group (LON:SPEC) Will Want To Turn Around Its Return Trends
What are the early trends we should look for to identify a stock that could multiply in value over the long term? Firstly, we'll want to see a proven return on capital employed (ROCE) that is increasing, and secondly, an expanding base of capital employed. Ultimately, this demonstrates that it's a business that is reinvesting profits at increasing rates of return. Having said that, from a first glance at INSPECS Group (LON:SPEC) we aren't jumping out of our chairs at how returns are trending, but let's have a deeper look.
Return On Capital Employed (ROCE): What Is It?
If you haven't worked with ROCE before, it measures the 'return' (pre-tax profit) a company generates from capital employed in its business. The formula for this calculation on INSPECS Group is:
Return on Capital Employed = Earnings Before Interest and Tax (EBIT) ÷ (Total Assets - Current Liabilities)
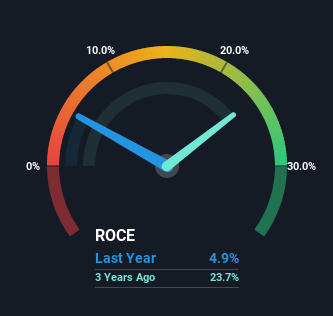
0.049 = US$11m ÷ (US$302m - US$79m) (Based on the trailing twelve months to June 2022).
Therefore, INSPECS Group has an ROCE of 4.9%. Ultimately, that's a low return and it under-performs the Medical Equipment industry average of 10%.
View our latest analysis for INSPECS Group
In the above chart we have measured INSPECS Group's prior ROCE against its prior performance, but the future is arguably more important. If you're interested, you can view the analysts predictions in our free report on analyst forecasts for the company.
The Trend Of ROCE
In terms of INSPECS Group's historical ROCE movements, the trend isn't fantastic. Around five years ago the returns on capital were 15%, but since then they've fallen to 4.9%. However, given capital employed and revenue have both increased it appears that the business is currently pursuing growth, at the consequence of short term returns. And if the increased capital generates additional returns, the business, and thus shareholders, will benefit in the long run.
On a side note, INSPECS Group has done well to pay down its current liabilities to 26% of total assets. So we could link some of this to the decrease in ROCE. Effectively this means their suppliers or short-term creditors are funding less of the business, which reduces some elements of risk. Some would claim this reduces the business' efficiency at generating ROCE since it is now funding more of the operations with its own money.
The Bottom Line
While returns have fallen for INSPECS Group in recent times, we're encouraged to see that sales are growing and that the business is reinvesting in its operations. However, despite the promising trends, the stock has fallen 59% over the last year, so there might be an opportunity here for astute investors. So we think it'd be worthwhile to look further into this stock given the trends look encouraging.
One more thing to note, we've identified 1 warning sign with INSPECS Group and understanding it should be part of your investment process.
While INSPECS Group may not currently earn the highest returns, we've compiled a list of companies that currently earn more than 25% return on equity. Check out this free list here.
Have feedback on this article? Concerned about the content? Get in touch with us directly. Alternatively, email editorial-team (at) simplywallst.com.
This article by Simply Wall St is general in nature. We provide commentary based on historical data and analyst forecasts only using an unbiased methodology and our articles are not intended to be financial advice. It does not constitute a recommendation to buy or sell any stock, and does not take account of your objectives, or your financial situation. We aim to bring you long-term focused analysis driven by fundamental data. Note that our analysis may not factor in the latest price-sensitive company announcements or qualitative material. Simply Wall St has no position in any stocks mentioned.
Join A Paid User Research Session
You’ll receive a US$30 Amazon Gift card for 1 hour of your time while helping us build better investing tools for the individual investors like yourself. Sign up here
