
 Yahoo Finance
 Inghams Group (ASX:ING) May Have Issues Allocating Its Capital
Did you know there are some financial metrics that can provide clues of a potential multi-bagger? Firstly, we'd want to identify a growing return on capital employed (ROCE) and then alongside that, an ever-increasing base of capital employed. If you see this, it typically means it's a company with a great business model and plenty of profitable reinvestment opportunities. However, after briefly looking over the numbers, we don't think Inghams Group (ASX:ING) has the makings of a multi-bagger going forward, but let's have a look at why that may be.
What Is Return On Capital Employed (ROCE)?
Just to clarify if you're unsure, ROCE is a metric for evaluating how much pre-tax income (in percentage terms) a company earns on the capital invested in its business. The formula for this calculation on Inghams Group is:
Return on Capital Employed = Earnings Before Interest and Tax (EBIT) ÷ (Total Assets - Current Liabilities)
0.12 = AU$221m ÷ (AU$2.6b - AU$748m) (Based on the trailing twelve months to December 2023).
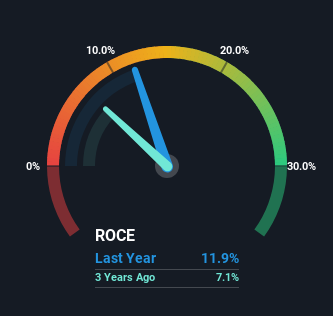
So, Inghams Group has an ROCE of 12%. That's a pretty standard return and it's in line with the industry average of 12%.
View our latest analysis for Inghams Group
In the above chart we have measured Inghams Group's prior ROCE against its prior performance, but the future is arguably more important. If you'd like to see what analysts are forecasting going forward, you should check out our free analyst report for Inghams Group .
So How Is Inghams Group's ROCE Trending?
On the surface, the trend of ROCE at Inghams Group doesn't inspire confidence. Over the last five years, returns on capital have decreased to 12% from 23% five years ago. Although, given both revenue and the amount of assets employed in the business have increased, it could suggest the company is investing in growth, and the extra capital has led to a short-term reduction in ROCE. And if the increased capital generates additional returns, the business, and thus shareholders, will benefit in the long run.
On a related note, Inghams Group has decreased its current liabilities to 29% of total assets. That could partly explain why the ROCE has dropped. Effectively this means their suppliers or short-term creditors are funding less of the business, which reduces some elements of risk. Some would claim this reduces the business' efficiency at generating ROCE since it is now funding more of the operations with its own money.
What We Can Learn From Inghams Group's ROCE
In summary, despite lower returns in the short term, we're encouraged to see that Inghams Group is reinvesting for growth and has higher sales as a result. In light of this, the stock has only gained 3.2% over the last five years. Therefore we'd recommend looking further into this stock to confirm if it has the makings of a good investment.
One final note, you should learn about the 2 warning signs we've spotted with Inghams Group (including 1 which is a bit concerning) .
If you want to search for solid companies with great earnings, check out this free list of companies with good balance sheets and impressive returns on equity.
Have feedback on this article? Concerned about the content? Get in touch with us directly. Alternatively, email editorial-team (at) simplywallst.com.
This article by Simply Wall St is general in nature. We provide commentary based on historical data and analyst forecasts only using an unbiased methodology and our articles are not intended to be financial advice. It does not constitute a recommendation to buy or sell any stock, and does not take account of your objectives, or your financial situation. We aim to bring you long-term focused analysis driven by fundamental data. Note that our analysis may not factor in the latest price-sensitive company announcements or qualitative material. Simply Wall St has no position in any stocks mentioned.
