
 Yahoo Finance
 Improved Revenues Required Before Swift Networks Group Limited (ASX:SW1) Stock's 64% Jump Looks Justified
Swift Networks Group Limited (ASX:SW1) shares have had a really impressive month, gaining 64% after a shaky period beforehand. Unfortunately, the gains of the last month did little to right the losses of the last year with the stock still down 10.0% over that time.
Even after such a large jump in price, Swift Networks Group's price-to-sales (or "P/S") ratio of 0.6x might still make it look like a buy right now compared to the Entertainment industry in Australia, where around half of the companies have P/S ratios above 2.1x and even P/S above 10x are quite common. Although, it's not wise to just take the P/S at face value as there may be an explanation why it's limited.
Check out our latest analysis for Swift Networks Group
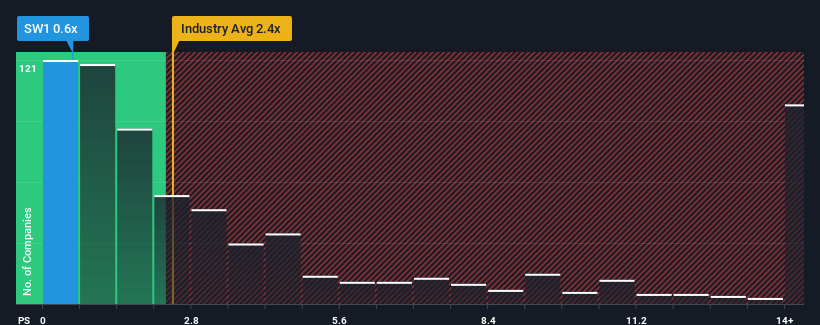
What Does Swift Networks Group's P/S Mean For Shareholders?
The revenue growth achieved at Swift Networks Group over the last year would be more than acceptable for most companies. One possibility is that the P/S is low because investors think this respectable revenue growth might actually underperform the broader industry in the near future. If you like the company, you'd be hoping this isn't the case so that you could potentially pick up some stock while it's out of favour.
Want the full picture on earnings, revenue and cash flow for the company? Then our free report on Swift Networks Group will help you shine a light on its historical performance.
What Are Revenue Growth Metrics Telling Us About The Low P/S?
Swift Networks Group's P/S ratio would be typical for a company that's only expected to deliver limited growth, and importantly, perform worse than the industry.
Taking a look back first, we see that the company managed to grow revenues by a handy 12% last year. Ultimately though, it couldn't turn around the poor performance of the prior period, with revenue shrinking 19% in total over the last three years. So unfortunately, we have to acknowledge that the company has not done a great job of growing revenue over that time.
Weighing that medium-term revenue trajectory against the broader industry's one-year forecast for expansion of 14% shows it's an unpleasant look.
In light of this, it's understandable that Swift Networks Group's P/S would sit below the majority of other companies. However, we think shrinking revenues are unlikely to lead to a stable P/S over the longer term, which could set up shareholders for future disappointment. Even just maintaining these prices could be difficult to achieve as recent revenue trends are already weighing down the shares.
The Key Takeaway
Swift Networks Group's stock price has surged recently, but its but its P/S still remains modest. While the price-to-sales ratio shouldn't be the defining factor in whether you buy a stock or not, it's quite a capable barometer of revenue expectations.
As we suspected, our examination of Swift Networks Group revealed its shrinking revenue over the medium-term is contributing to its low P/S, given the industry is set to grow. At this stage investors feel the potential for an improvement in revenue isn't great enough to justify a higher P/S ratio. If recent medium-term revenue trends continue, it's hard to see the share price moving strongly in either direction in the near future under these circumstances.
Don't forget that there may be other risks. For instance, we've identified 3 warning signs for Swift Networks Group (2 are a bit concerning) you should be aware of.
If these risks are making you reconsider your opinion on Swift Networks Group, explore our interactive list of high quality stocks to get an idea of what else is out there.
Have feedback on this article? Concerned about the content? Get in touch with us directly. Alternatively, email editorial-team (at) simplywallst.com.
This article by Simply Wall St is general in nature. We provide commentary based on historical data and analyst forecasts only using an unbiased methodology and our articles are not intended to be financial advice. It does not constitute a recommendation to buy or sell any stock, and does not take account of your objectives, or your financial situation. We aim to bring you long-term focused analysis driven by fundamental data. Note that our analysis may not factor in the latest price-sensitive company announcements or qualitative material. Simply Wall St has no position in any stocks mentioned.
Join A Paid User Research Session
You’ll receive a US$30 Amazon Gift card for 1 hour of your time while helping us build better investing tools for the individual investors like yourself. Sign up here
