
 Yahoo Finance
 Should You Be Impressed By VEON Ltd.'s (NASDAQ:VEON) ROE?
Many investors are still learning about the various metrics that can be useful when analysing a stock. This article is for those who would like to learn about Return On Equity (ROE). We'll use ROE to examine VEON Ltd. (NASDAQ:VEON), by way of a worked example.
Return on Equity or ROE is a test of how effectively a company is growing its value and managing investors’ money. In other words, it is a profitability ratio which measures the rate of return on the capital provided by the company's shareholders.
View our latest analysis for VEON
How Do You Calculate Return On Equity?
The formula for ROE is:
Return on Equity = Net Profit (from continuing operations) ÷ Shareholders' Equity
So, based on the above formula, the ROE for VEON is:
36% = US$384m ÷ US$1.1b (Based on the trailing twelve months to December 2023).
The 'return' is the profit over the last twelve months. Another way to think of that is that for every $1 worth of equity, the company was able to earn $0.36 in profit.
Does VEON Have A Good Return On Equity?
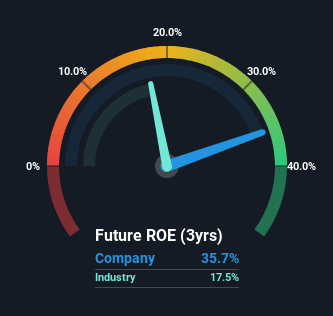
Arguably the easiest way to assess company's ROE is to compare it with the average in its industry. The limitation of this approach is that some companies are quite different from others, even within the same industry classification. As you can see in the graphic below, VEON has a higher ROE than the average (18%) in the Wireless Telecom industry.
That's what we like to see. However, bear in mind that a high ROE doesn’t necessarily indicate efficient profit generation. A higher proportion of debt in a company's capital structure may also result in a high ROE, where the high debt levels could be a huge risk . To know the 2 risks we have identified for VEON visit our risks dashboard for free.
The Importance Of Debt To Return On Equity
Companies usually need to invest money to grow their profits. That cash can come from retained earnings, issuing new shares (equity), or debt. In the case of the first and second options, the ROE will reflect this use of cash, for growth. In the latter case, the debt required for growth will boost returns, but will not impact the shareholders' equity. Thus the use of debt can improve ROE, albeit along with extra risk in the case of stormy weather, metaphorically speaking.
Combining VEON's Debt And Its 36% Return On Equity
It appears that VEON makes extensive use of debt to improve its returns, because it has an alarmingly high debt to equity ratio of 3.51. So although the company has an impressive ROE, the company might not have been able to achieve this without the significant use of debt.
Summary
Return on equity is a useful indicator of the ability of a business to generate profits and return them to shareholders. A company that can achieve a high return on equity without debt could be considered a high quality business. If two companies have the same ROE, then I would generally prefer the one with less debt.
Having said that, while ROE is a useful indicator of business quality, you'll have to look at a whole range of factors to determine the right price to buy a stock. The rate at which profits are likely to grow, relative to the expectations of profit growth reflected in the current price, must be considered, too. So you might want to check this FREE visualization of analyst forecasts for the company.
Of course VEON may not be the best stock to buy. So you may wish to see this free collection of other companies that have high ROE and low debt.
Have feedback on this article? Concerned about the content? Get in touch with us directly. Alternatively, email editorial-team (at) simplywallst.com.
This article by Simply Wall St is general in nature. We provide commentary based on historical data and analyst forecasts only using an unbiased methodology and our articles are not intended to be financial advice. It does not constitute a recommendation to buy or sell any stock, and does not take account of your objectives, or your financial situation. We aim to bring you long-term focused analysis driven by fundamental data. Note that our analysis may not factor in the latest price-sensitive company announcements or qualitative material. Simply Wall St has no position in any stocks mentioned.
