
 Yahoo Finance
 Should You Be Impressed By St Barbara's (ASX:SBM) Returns on Capital?
There are a few key trends to look for if we want to identify the next multi-bagger. Ideally, a business will show two trends; firstly a growing return on capital employed (ROCE) and secondly, an increasing amount of capital employed. Put simply, these types of businesses are compounding machines, meaning they are continually reinvesting their earnings at ever-higher rates of return. However, after briefly looking over the numbers, we don't think St Barbara (ASX:SBM) has the makings of a multi-bagger going forward, but let's have a look at why that may be.
Return On Capital Employed (ROCE): What is it?
If you haven't worked with ROCE before, it measures the 'return' (pre-tax profit) a company generates from capital employed in its business. To calculate this metric for St Barbara, this is the formula:
Return on Capital Employed = Earnings Before Interest and Tax (EBIT) ÷ (Total Assets - Current Liabilities)
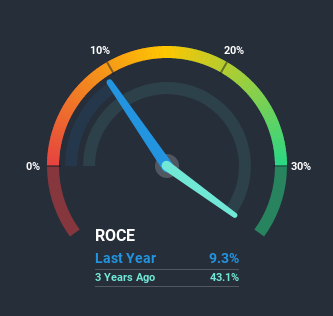
0.093 = AU$191m ÷ (AU$2.2b - AU$116m) (Based on the trailing twelve months to June 2020).
So, St Barbara has an ROCE of 9.3%. In absolute terms, that's a low return but it's around the Metals and Mining industry average of 9.5%.
See our latest analysis for St Barbara
In the above chart we have measured St Barbara's prior ROCE against its prior performance, but the future is arguably more important. If you're interested, you can view the analysts predictions in our free report on analyst forecasts for the company.
What The Trend Of ROCE Can Tell Us
When we looked at the ROCE trend at St Barbara, we didn't gain much confidence. To be more specific, ROCE has fallen from 16% over the last five years. However, given capital employed and revenue have both increased it appears that the business is currently pursuing growth, at the consequence of short term returns. And if the increased capital generates additional returns, the business, and thus shareholders, will benefit in the long run.
On a related note, St Barbara has decreased its current liabilities to 5.3% of total assets. So we could link some of this to the decrease in ROCE. What's more, this can reduce some aspects of risk to the business because now the company's suppliers or short-term creditors are funding less of its operations. Some would claim this reduces the business' efficiency at generating ROCE since it is now funding more of the operations with its own money.
The Key Takeaway
In summary, despite lower returns in the short term, we're encouraged to see that St Barbara is reinvesting for growth and has higher sales as a result. And long term investors must be optimistic going forward because the stock has returned a huge 122% to shareholders in the last five years. So should these growth trends continue, we'd be optimistic on the stock going forward.
If you'd like to know about the risks facing St Barbara, we've discovered 2 warning signs that you should be aware of.
While St Barbara isn't earning the highest return, check out this free list of companies that are earning high returns on equity with solid balance sheets.
This article by Simply Wall St is general in nature. It does not constitute a recommendation to buy or sell any stock, and does not take account of your objectives, or your financial situation. We aim to bring you long-term focused analysis driven by fundamental data. Note that our analysis may not factor in the latest price-sensitive company announcements or qualitative material. Simply Wall St has no position in any stocks mentioned.
Have feedback on this article? Concerned about the content? Get in touch with us directly. Alternatively, email editorial-team@simplywallst.com.
