
 Yahoo Finance
 Imperial Brands PLC's Dividend Analysis
Exploring the Sustainability and Growth of Imperial Brands PLC's Dividends
Imperial Brands PLC (IMBBY) recently announced a dividend of $0.28 per share, payable on 2024-07-08, with the ex-dividend date set for 2024-05-24. As investors look forward to this upcoming payment, the spotlight also shines on the company's dividend history, yield, and growth rates. Using the data from GuruFocus, let's look into Imperial Brands PLC's dividend performance and assess its sustainability.
What Does Imperial Brands PLC Do?
This Powerful Chart Made Peter Lynch 29% A Year For 13 Years
How to calculate the intrinsic value of a stock?
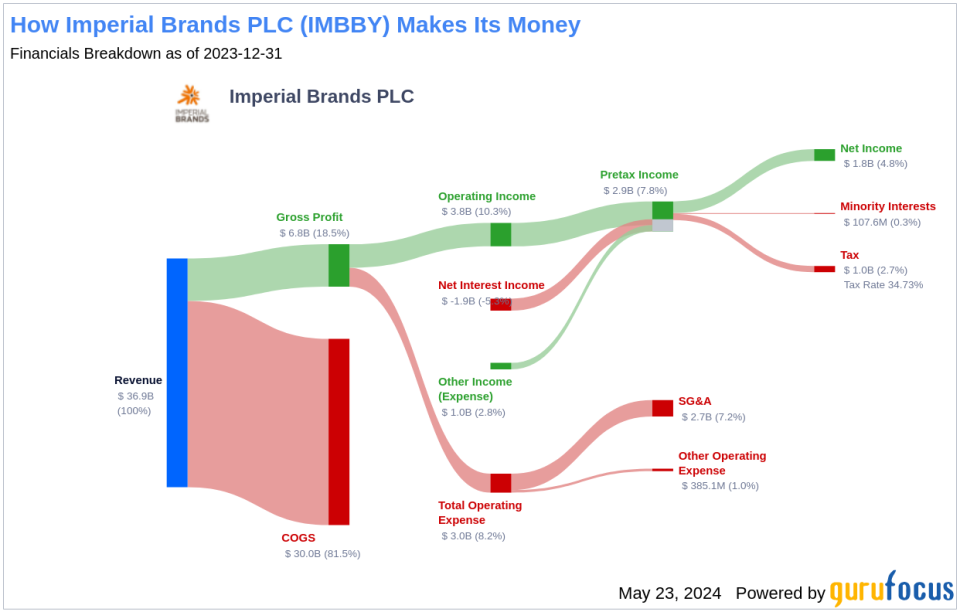
Imperial Brands is the world's fourth-largest international tobacco company (excluding China National Tobacco) with a total fiscal 2023 volume of 198 billion cigarettes sold in more than 160 countries. The firm holds a leading global position in the fine-cut tobacco and hand-rolling paper categories, and it has a logistics platform in Western Europe, Altadis. Through acquisition, Imperial is the third-largest manufacturer in the US and owns the Winston and blu brands.
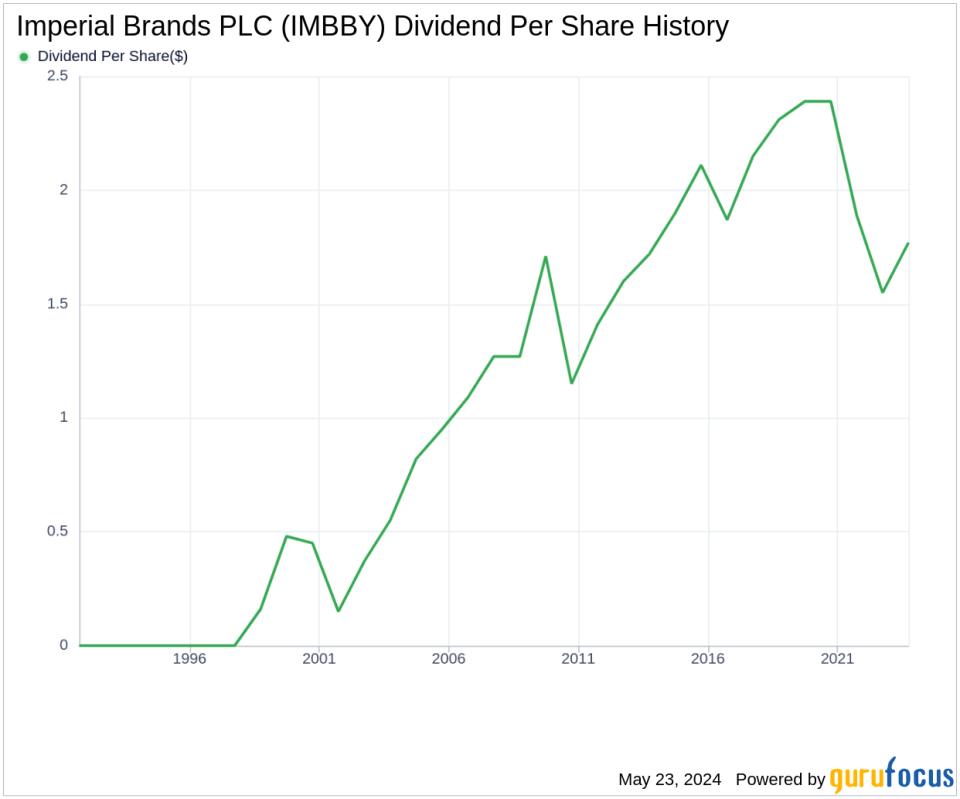
A Glimpse at Imperial Brands PLC's Dividend History
Imperial Brands PLC has maintained a consistent dividend payment record since 1998. Dividends are currently distributed on a quarterly basis.
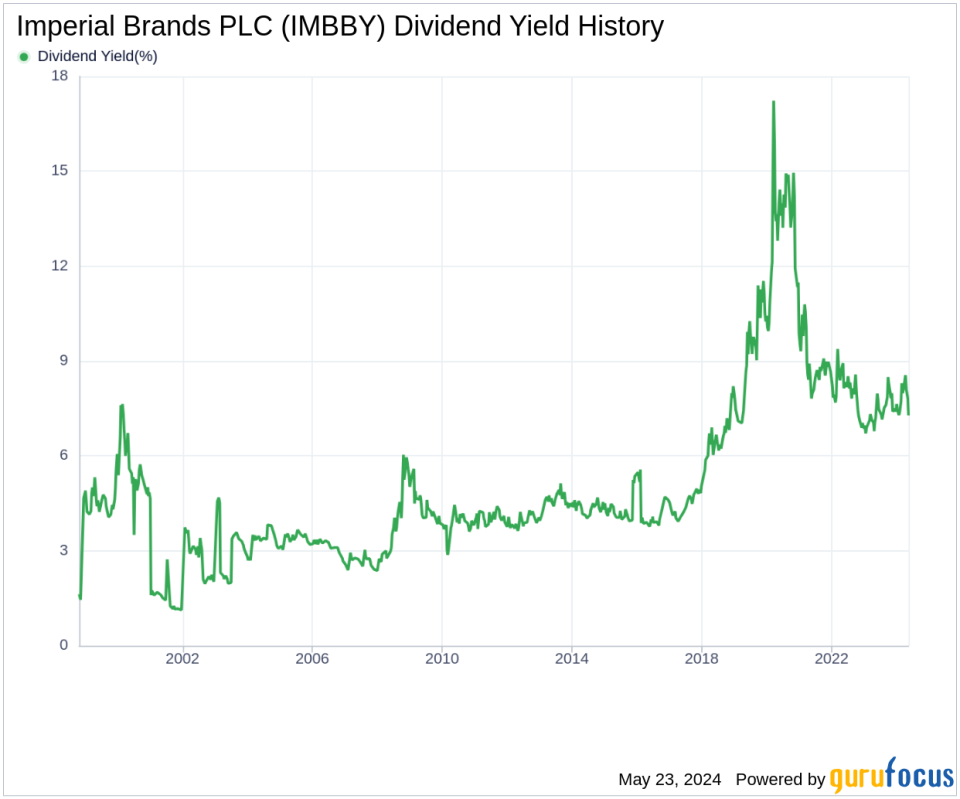
Breaking Down Imperial Brands PLC's Dividend Yield and Growth
As of today, Imperial Brands PLC currently has a 12-month trailing dividend yield of 7.38% and a 12-month forward dividend yield of 4.53%. This suggests an expectation of decreased dividend payments over the next 12 months.
Over the past three years, Imperial Brands PLC's annual dividend growth rate was -8.60%. Extended to a five-year horizon, this rate increased to -6.50% per year. And over the past decade, Imperial Brands PLC's annual dividends per share growth rate stands at 2.50%.
The Sustainability Question: Payout Ratio and Profitability
To assess the sustainability of the dividend, one needs to evaluate the company's payout ratio. The dividend payout ratio provides insights into the portion of earnings the company distributes as dividends. A lower ratio suggests that the company retains a significant part of its earnings, thereby ensuring the availability of funds for future growth and unexpected downturns. As of 2024-03-31, Imperial Brands PLC's dividend payout ratio is 0.53.
Imperial Brands PLC's profitability rank, offers an understanding of the company's earnings prowess relative to its peers. GuruFocus ranks Imperial Brands PLC's profitability 8 out of 10 as of 2024-03-31, suggesting good profitability prospects. The company has reported positive net income for each year over the past decade, further solidifying its high profitability.
Growth Metrics: The Future Outlook
To ensure the sustainability of dividends, a company must have robust growth metrics. Imperial Brands PLC's growth rank of 8 out of 10 suggests that the company's growth trajectory is good relative to its competitors.
Revenue is the lifeblood of any company, and Imperial Brands PLC's revenue per share, combined with the 3-year revenue growth rate, indicates a strong revenue model. Imperial Brands PLC's revenue has increased by approximately 0.50% per year on average, a rate that underperforms approximately 74.42% of global competitors.
The company's 3-year EPS growth rate showcases its capability to grow its earnings, a critical component for sustaining dividends in the long run. During the past three years, Imperial Brands PLC's earnings increased by approximately 2.90% per year on average, a rate that underperforms approximately 64.1% of global competitors.
Lastly, the company's 5-year EBITDA growth rate of -0.10%, which underperforms approximately 76.47% of global competitors.
Conclusion: Evaluating Imperial Brands PLC's Dividend Outlook
Considering Imperial Brands PLC's consistent dividend payments, its robust profitability, and the challenges in growth metrics, investors should weigh these factors when assessing the company's future dividend potential. While the payout ratio and profitability suggest a stable dividend payout, the negative growth rates in dividends and some financial metrics could be a concern. Investors might want to keep a close watch on these trends to make informed decisions.
GuruFocus Premium users can screen for high-dividend yield stocks using the High Dividend Yield Screener.
This article, generated by GuruFocus, is designed to provide general insights and is not tailored financial advice. Our commentary is rooted in historical data and analyst projections, utilizing an impartial methodology, and is not intended to serve as specific investment guidance. It does not formulate a recommendation to purchase or divest any stock and does not consider individual investment objectives or financial circumstances. Our objective is to deliver long-term, fundamental data-driven analysis. Be aware that our analysis might not incorporate the most recent, price-sensitive company announcements or qualitative information. GuruFocus holds no position in the stocks mentioned herein.
This article first appeared on GuruFocus.
