
 Yahoo Finance
 Can You Imagine How Baby Bunting Group’s Shareholders Feel About The 65% Share Price Increase?

If you want to compound wealth in the stock market, you can do so by buying an index fund. But investors can boost returns by picking market-beating companies to own shares in. To wit, the Baby Bunting Group Limited (ASX:BBN) share price is 65% higher than it was a year ago, much better than the market return of around 5.3% (not including dividends) in the same period. If it can keep that out-performance up over the long term, investors will do very well! On the other hand, longer term shareholders have had a tougher run, with the stock falling 2.4% in three years.
Check out our latest analysis for Baby Bunting Group
In his essay The Superinvestors of Graham-and-Doddsville Warren Buffett described how share prices do not always rationally reflect the value of a business. One flawed but reasonable way to assess how sentiment around a company has changed is to compare the earnings per share (EPS) with the share price.
Over the last twelve months, Baby Bunting Group actually shrank its EPS by 11%. This means it’s unlikely the market is judging the company based on earnings growth. Therefore, it seems likely that investors are putting more weight on metrics other than EPS, at the moment.
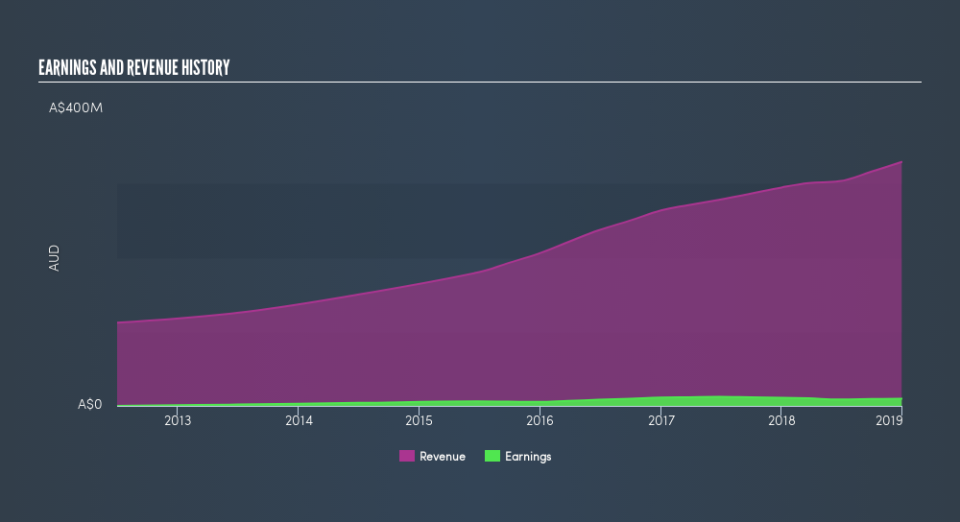
We think that the revenue growth of 12% could have some investors interested. Many businesses do go through a faze where they have to forgo some profits to drive business development, and sometimes its for the best.
You can see how revenue and earnings have changed over time in the image below, (click on the chart to see cashflow).
If you are thinking of buying or selling Baby Bunting Group stock, you should check out this FREE detailed report on its balance sheet.
What About Dividends?
As well as measuring the share price return, investors should also consider the total shareholder return (TSR). The TSR incorporates the value of any discounted capital raisings, along with any dividends, based on the assumption that the dividends are reinvested. Arguably, the TSR gives a more comprehensive picture of the return generated by a stock. We note that for Baby Bunting Group the TSR over the last year was 69%, which is better than the share price return mentioned above. The dividends paid by the company have thusly boosted the total shareholder return.
A Different Perspective
Pleasingly, Baby Bunting Group’s total shareholder return last year was 69%. That’s including the dividend. That gain actually surpasses the 2.6% TSR it generated (per year) over three years. Given the track record of solid returns over varying time frames, it might be worth putting Baby Bunting Group on your watchlist. Most investors take the time to check the data on insider transactions. You can click here to see if insiders have been buying or selling.
Of course, you might find a fantastic investment by looking elsewhere. So take a peek at this free list of companies we expect will grow earnings.
Please note, the market returns quoted in this article reflect the market weighted average returns of stocks that currently trade on AU exchanges.
We aim to bring you long-term focused research analysis driven by fundamental data. Note that our analysis may not factor in the latest price-sensitive company announcements or qualitative material.
If you spot an error that warrants correction, please contact the editor at editorial-team@simplywallst.com. This article by Simply Wall St is general in nature. It does not constitute a recommendation to buy or sell any stock, and does not take account of your objectives, or your financial situation. Simply Wall St has no position in the stocks mentioned. Thank you for reading.
