
 Yahoo Finance
 Image Resources NL (ASX:IMA) Earns Among The Best Returns In Its Industry

Today we'll look at Image Resources NL (ASX:IMA) and reflect on its potential as an investment. In particular, we'll consider its Return On Capital Employed (ROCE), as that can give us insight into how profitably the company is able to employ capital in its business.
First, we'll go over how we calculate ROCE. Next, we'll compare it to others in its industry. Last but not least, we'll look at what impact its current liabilities have on its ROCE.
What is Return On Capital Employed (ROCE)?
ROCE is a metric for evaluating how much pre-tax income (in percentage terms) a company earns on the capital invested in its business. Generally speaking a higher ROCE is better. Overall, it is a valuable metric that has its flaws. Renowned investment researcher Michael Mauboussin has suggested that a high ROCE can indicate that 'one dollar invested in the company generates value of more than one dollar'.
So, How Do We Calculate ROCE?
The formula for calculating the return on capital employed is:
Return on Capital Employed = Earnings Before Interest and Tax (EBIT) ÷ (Total Assets - Current Liabilities)
Or for Image Resources:
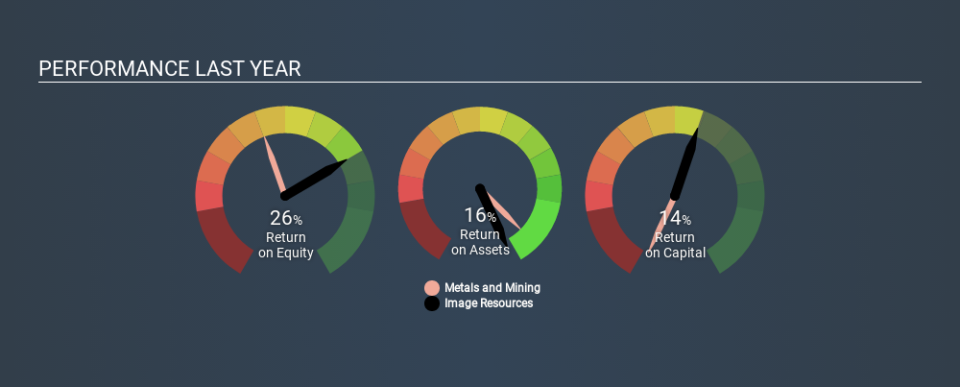
0.14 = AU$15m ÷ (AU$155m - AU$48m) (Based on the trailing twelve months to June 2019.)
Therefore, Image Resources has an ROCE of 14%.
See our latest analysis for Image Resources
Does Image Resources Have A Good ROCE?
ROCE is commonly used for comparing the performance of similar businesses. Using our data, we find that Image Resources's ROCE is meaningfully better than the 8.0% average in the Metals and Mining industry. I think that's good to see, since it implies the company is better than other companies at making the most of its capital. Independently of how Image Resources compares to its industry, its ROCE in absolute terms appears decent, and the company may be worthy of closer investigation.
Image Resources has an ROCE of 14%, but it didn't have an ROCE 3 years ago, since it was unprofitable. That implies the business has been improving. The image below shows how Image Resources's ROCE compares to its industry, and you can click it to see more detail on its past growth.
Remember that this metric is backwards looking - it shows what has happened in the past, and does not accurately predict the future. ROCE can be misleading for companies in cyclical industries, with returns looking impressive during the boom times, but very weak during the busts. ROCE is, after all, simply a snap shot of a single year. Given the industry it operates in, Image Resources could be considered cyclical. What happens in the future is pretty important for investors, so we have prepared a free report on analyst forecasts for Image Resources.
What Are Current Liabilities, And How Do They Affect Image Resources's ROCE?
Liabilities, such as supplier bills and bank overdrafts, are referred to as current liabilities if they need to be paid within 12 months. The ROCE equation subtracts current liabilities from capital employed, so a company with a lot of current liabilities appears to have less capital employed, and a higher ROCE than otherwise. To check the impact of this, we calculate if a company has high current liabilities relative to its total assets.
Image Resources has total liabilities of AU$48m and total assets of AU$155m. As a result, its current liabilities are equal to approximately 31% of its total assets. Image Resources has a medium level of current liabilities, which would boost the ROCE.
What We Can Learn From Image Resources's ROCE
With a decent ROCE, the company could be interesting, but remember that the level of current liabilities make the ROCE look better. Image Resources shapes up well under this analysis, but it is far from the only business delivering excellent numbers . You might also want to check this free collection of companies delivering excellent earnings growth.
If you like to buy stocks alongside management, then you might just love this free list of companies. (Hint: insiders have been buying them).
If you spot an error that warrants correction, please contact the editor at editorial-team@simplywallst.com. This article by Simply Wall St is general in nature. It does not constitute a recommendation to buy or sell any stock, and does not take account of your objectives, or your financial situation. Simply Wall St has no position in the stocks mentioned.
We aim to bring you long-term focused research analysis driven by fundamental data. Note that our analysis may not factor in the latest price-sensitive company announcements or qualitative material. Thank you for reading.
