
 Yahoo Finance
 Is Image Resources NL (ASX:IMA) Popular Amongst Insiders?

If you want to know who really controls Image Resources NL (ASX:IMA), then you'll have to look at the makeup of its share registry. Institutions often own shares in more established companies, while it's not unusual to see insiders own a fair bit of smaller companies. Warren Buffett said that he likes "a business with enduring competitive advantages that is run by able and owner-oriented people." So it's nice to see some insider ownership, because it may suggest that management is owner-oriented.
Image Resources is a smaller company with a market capitalization of AU$206m, so it may still be flying under the radar of many institutional investors. Our analysis of the ownership of the company, below, shows that institutions are noticeable on the share registry. Let's take a closer look to see what the different types of shareholders can tell us about Image Resources.
Check out our latest analysis for Image Resources
What Does The Institutional Ownership Tell Us About Image Resources?
Many institutions measure their performance against an index that approximates the local market. So they usually pay more attention to companies that are included in major indices.
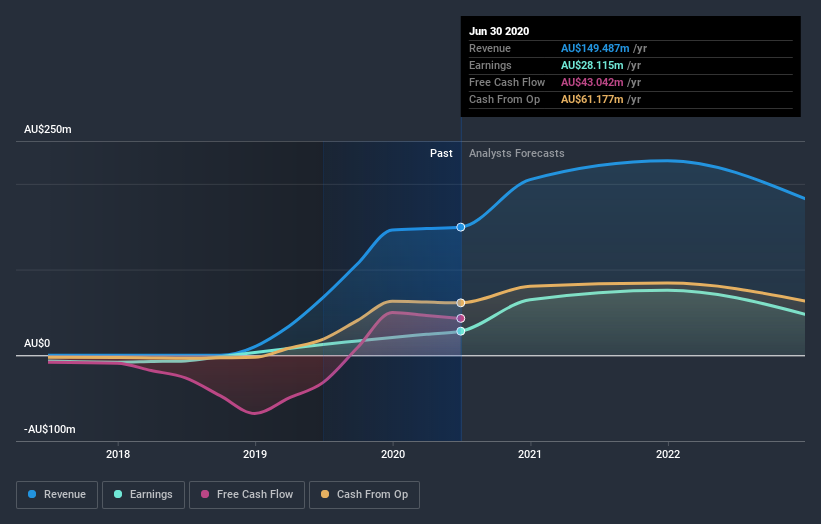
We can see that Image Resources does have institutional investors; and they hold a good portion of the company's stock. This implies the analysts working for those institutions have looked at the stock and they like it. But just like anyone else, they could be wrong. When multiple institutions own a stock, there's always a risk that they are in a 'crowded trade'. When such a trade goes wrong, multiple parties may compete to sell stock fast. This risk is higher in a company without a history of growth. You can see Image Resources' historic earnings and revenue below, but keep in mind there's always more to the story.
We note that hedge funds don't have a meaningful investment in Image Resources. Guangdong Orient Zirconic Ind Sci & Tech Co., Ltd. is currently the company's largest shareholder with 21% of shares outstanding. Meanwhile, the second and third largest shareholders, hold 13% and 6.6%, of the shares outstanding, respectively.
We also observed that the top 7 shareholders account for more than half of the share register, with a few smaller shareholders to balance the interests of the larger ones to a certain extent.
Researching institutional ownership is a good way to gauge and filter a stock's expected performance. The same can be achieved by studying analyst sentiments. While there is some analyst coverage, the company is probably not widely covered. So it could gain more attention, down the track.
Insider Ownership Of Image Resources
The definition of company insiders can be subjective and does vary between jurisdictions. Our data reflects individual insiders, capturing board members at the very least. The company management answer to the board and the latter should represent the interests of shareholders. Notably, sometimes top-level managers are on the board themselves.
Most consider insider ownership a positive because it can indicate the board is well aligned with other shareholders. However, on some occasions too much power is concentrated within this group.
Shareholders would probably be interested to learn that insiders own shares in Image Resources NL. In their own names, insiders own AU$18m worth of stock in the AU$206m company. It is good to see some investment by insiders, but I usually like to see higher insider holdings. It might be worth checking if those insiders have been buying.
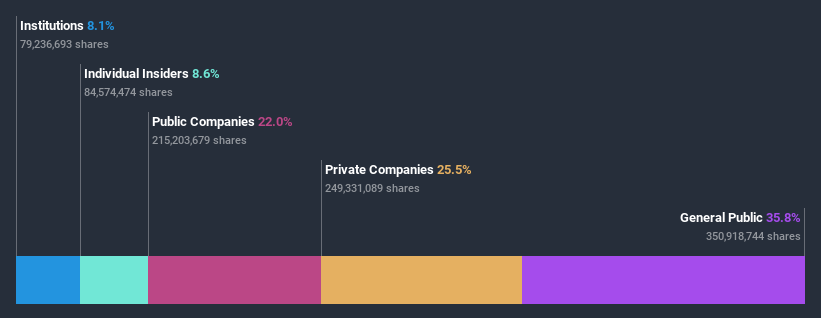
General Public Ownership
The general public holds a 36% stake in Image Resources. While this group can't necessarily call the shots, it can certainly have a real influence on how the company is run.
Private Company Ownership
Our data indicates that Private Companies hold 25%, of the company's shares. Private companies may be related parties. Sometimes insiders have an interest in a public company through a holding in a private company, rather than in their own capacity as an individual. While it's hard to draw any broad stroke conclusions, it is worth noting as an area for further research.
Public Company Ownership
We can see that public companies hold 22% of the Image Resources shares on issue. We can't be certain but it is quite possible this is a strategic stake. The businesses may be similar, or work together.
Next Steps:
It's always worth thinking about the different groups who own shares in a company. But to understand Image Resources better, we need to consider many other factors.
I like to dive deeper into how a company has performed in the past. You can find historic revenue and earnings in this detailed graph.
If you are like me, you may want to think about whether this company will grow or shrink. Luckily, you can check this free report showing analyst forecasts for its future.
NB: Figures in this article are calculated using data from the last twelve months, which refer to the 12-month period ending on the last date of the month the financial statement is dated. This may not be consistent with full year annual report figures.
This article by Simply Wall St is general in nature. It does not constitute a recommendation to buy or sell any stock, and does not take account of your objectives, or your financial situation. We aim to bring you long-term focused analysis driven by fundamental data. Note that our analysis may not factor in the latest price-sensitive company announcements or qualitative material. Simply Wall St has no position in any stocks mentioned.
Have feedback on this article? Concerned about the content? Get in touch with us directly. Alternatively, email editorial-team@simplywallst.com.
