
 Yahoo Finance
 Has Imaflex Inc.'s (CVE:IFX) Impressive Stock Performance Got Anything to Do With Its Fundamentals?
Imaflex (CVE:IFX) has had a great run on the share market with its stock up by a significant 48% over the last month. As most would know, fundamentals are what usually guide market price movements over the long-term, so we decided to look at the company's key financial indicators today to determine if they have any role to play in the recent price movement. Particularly, we will be paying attention to Imaflex's ROE today.
Return on equity or ROE is an important factor to be considered by a shareholder because it tells them how effectively their capital is being reinvested. In short, ROE shows the profit each dollar generates with respect to its shareholder investments.
Check out our latest analysis for Imaflex
How Do You Calculate Return On Equity?
ROE can be calculated by using the formula:
Return on Equity = Net Profit (from continuing operations) ÷ Shareholders' Equity
So, based on the above formula, the ROE for Imaflex is:
2.5% = CA$1.4m ÷ CA$58m (Based on the trailing twelve months to March 2024).
The 'return' refers to a company's earnings over the last year. Another way to think of that is that for every CA$1 worth of equity, the company was able to earn CA$0.02 in profit.
What Has ROE Got To Do With Earnings Growth?
Thus far, we have learned that ROE measures how efficiently a company is generating its profits. Depending on how much of these profits the company reinvests or "retains", and how effectively it does so, we are then able to assess a company’s earnings growth potential. Assuming all else is equal, companies that have both a higher return on equity and higher profit retention are usually the ones that have a higher growth rate when compared to companies that don't have the same features.
Imaflex's Earnings Growth And 2.5% ROE
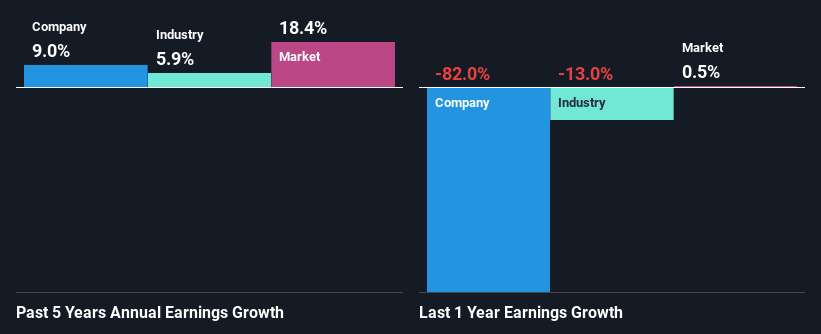
As you can see, Imaflex's ROE looks pretty weak. Even when compared to the industry average of 10%, the ROE figure is pretty disappointing. Imaflex was still able to see a decent net income growth of 9.0% over the past five years. We believe that there might be other aspects that are positively influencing the company's earnings growth. For example, it is possible that the company's management has made some good strategic decisions, or that the company has a low payout ratio.
As a next step, we compared Imaflex's net income growth with the industry, and pleasingly, we found that the growth seen by the company is higher than the average industry growth of 5.9%.
Earnings growth is a huge factor in stock valuation. The investor should try to establish if the expected growth or decline in earnings, whichever the case may be, is priced in. Doing so will help them establish if the stock's future looks promising or ominous. Is Imaflex fairly valued compared to other companies? These 3 valuation measures might help you decide.
Is Imaflex Making Efficient Use Of Its Profits?
Imaflex doesn't pay any regular dividends, meaning that all of its profits are being reinvested in the business, which explains the fair bit of earnings growth the company has seen.
Summary
In total, it does look like Imaflex has some positive aspects to its business. With a high rate of reinvestment, albeit at a low ROE, the company has managed to see a considerable growth in its earnings. While we won't completely dismiss the company, what we would do, is try to ascertain how risky the business is to make a more informed decision around the company. You can see the 3 risks we have identified for Imaflex by visiting our risks dashboard for free on our platform here.
Have feedback on this article? Concerned about the content? Get in touch with us directly. Alternatively, email editorial-team (at) simplywallst.com.
This article by Simply Wall St is general in nature. We provide commentary based on historical data and analyst forecasts only using an unbiased methodology and our articles are not intended to be financial advice. It does not constitute a recommendation to buy or sell any stock, and does not take account of your objectives, or your financial situation. We aim to bring you long-term focused analysis driven by fundamental data. Note that our analysis may not factor in the latest price-sensitive company announcements or qualitative material. Simply Wall St has no position in any stocks mentioned.
