
 Yahoo Finance
 IES Holdings' (NASDAQ:IESC) five-year total shareholder returns outpace the underlying earnings growth
Buying shares in the best businesses can build meaningful wealth for you and your family. While not every stock performs well, when investors win, they can win big. Just think about the savvy investors who held IES Holdings, Inc. (NASDAQ:IESC) shares for the last five years, while they gained 838%. If that doesn't get you thinking about long term investing, we don't know what will. On top of that, the share price is up 51% in about a quarter. The company reported its financial results recently; you can catch up on the latest numbers by reading our company report. Anyone who held for that rewarding ride would probably be keen to talk about it.
Although IES Holdings has shed US$297m from its market cap this week, let's take a look at its longer term fundamental trends and see if they've driven returns.
Check out our latest analysis for IES Holdings
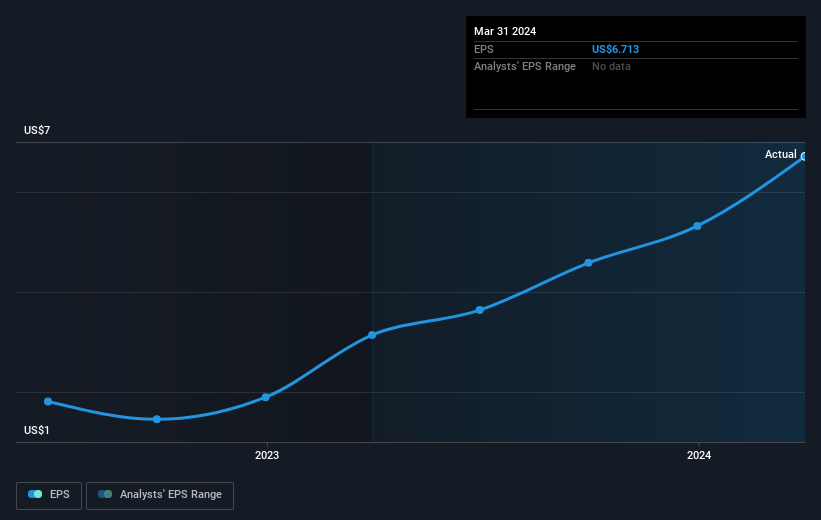
To paraphrase Benjamin Graham: Over the short term the market is a voting machine, but over the long term it's a weighing machine. One flawed but reasonable way to assess how sentiment around a company has changed is to compare the earnings per share (EPS) with the share price.
During five years of share price growth, IES Holdings achieved compound earnings per share (EPS) growth of 41% per year. This EPS growth is lower than the 56% average annual increase in the share price. So it's fair to assume the market has a higher opinion of the business than it did five years ago. And that's hardly shocking given the track record of growth.
The graphic below depicts how EPS has changed over time (unveil the exact values by clicking on the image).
It's probably worth noting that the CEO is paid less than the median at similar sized companies. But while CEO remuneration is always worth checking, the really important question is whether the company can grow earnings going forward. This free interactive report on IES Holdings' earnings, revenue and cash flow is a great place to start, if you want to investigate the stock further.
A Different Perspective
We're pleased to report that IES Holdings shareholders have received a total shareholder return of 228% over one year. Since the one-year TSR is better than the five-year TSR (the latter coming in at 56% per year), it would seem that the stock's performance has improved in recent times. In the best case scenario, this may hint at some real business momentum, implying that now could be a great time to delve deeper. It's always interesting to track share price performance over the longer term. But to understand IES Holdings better, we need to consider many other factors. For instance, we've identified 1 warning sign for IES Holdings that you should be aware of.
If you like to buy stocks alongside management, then you might just love this free list of companies. (Hint: many of them are unnoticed AND have attractive valuation).
Please note, the market returns quoted in this article reflect the market weighted average returns of stocks that currently trade on American exchanges.
Have feedback on this article? Concerned about the content? Get in touch with us directly. Alternatively, email editorial-team (at) simplywallst.com.
This article by Simply Wall St is general in nature. We provide commentary based on historical data and analyst forecasts only using an unbiased methodology and our articles are not intended to be financial advice. It does not constitute a recommendation to buy or sell any stock, and does not take account of your objectives, or your financial situation. We aim to bring you long-term focused analysis driven by fundamental data. Note that our analysis may not factor in the latest price-sensitive company announcements or qualitative material. Simply Wall St has no position in any stocks mentioned.
