
 Yahoo Finance
 Horizon Minerals (ASX:HRZ) swells 13% this week, taking five-year gains to 45%
Generally speaking the aim of active stock picking is to find companies that provide returns that are superior to the market average. Buying under-rated businesses is one path to excess returns. For example, long term Horizon Minerals Limited (ASX:HRZ) shareholders have enjoyed a 45% share price rise over the last half decade, well in excess of the market return of around 27% (not including dividends). However, more recent returns haven't been as impressive as that, with the stock returning just 17% in the last year.
Since the stock has added AU$8.5m to its market cap in the past week alone, let's see if underlying performance has been driving long-term returns.
View our latest analysis for Horizon Minerals
To quote Buffett, 'Ships will sail around the world but the Flat Earth Society will flourish. There will continue to be wide discrepancies between price and value in the marketplace...' One flawed but reasonable way to assess how sentiment around a company has changed is to compare the earnings per share (EPS) with the share price.
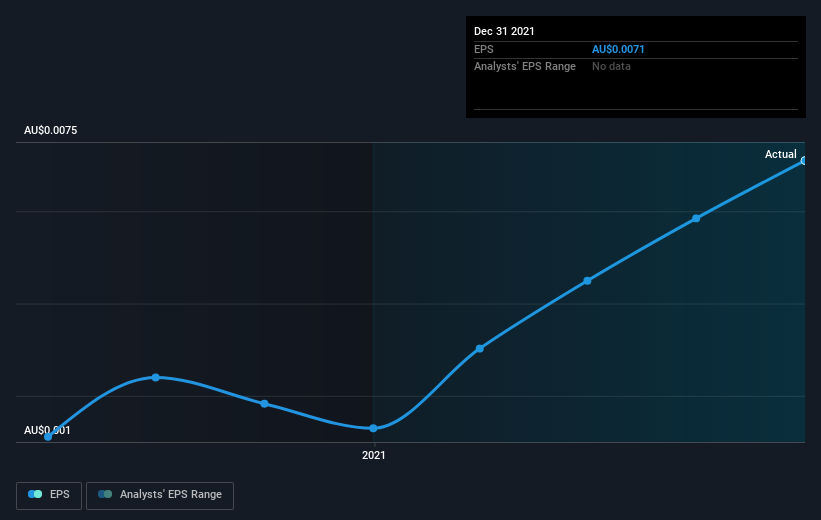
During the five years of share price growth, Horizon Minerals moved from a loss to profitability. That would generally be considered a positive, so we'd expect the share price to be up. Since the company was unprofitable five years ago, but not three years ago, it's worth taking a look at the returns in the last three years, too. We can see that the Horizon Minerals share price is up 13% in the last three years. Meanwhile, EPS is up 13% per year. This EPS growth is higher than the 4% average annual increase in the share price over the same three years. Therefore, it seems the market has moderated its expectations for growth, somewhat.
You can see how EPS has changed over time in the image below (click on the chart to see the exact values).
Dive deeper into Horizon Minerals' key metrics by checking this interactive graph of Horizon Minerals's earnings, revenue and cash flow.
A Different Perspective
It's nice to see that Horizon Minerals shareholders have received a total shareholder return of 17% over the last year. That gain is better than the annual TSR over five years, which is 8%. Therefore it seems like sentiment around the company has been positive lately. Someone with an optimistic perspective could view the recent improvement in TSR as indicating that the business itself is getting better with time. I find it very interesting to look at share price over the long term as a proxy for business performance. But to truly gain insight, we need to consider other information, too. To that end, you should learn about the 3 warning signs we've spotted with Horizon Minerals (including 1 which is concerning) .
If you are like me, then you will not want to miss this free list of growing companies that insiders are buying.
Please note, the market returns quoted in this article reflect the market weighted average returns of stocks that currently trade on AU exchanges.
Have feedback on this article? Concerned about the content? Get in touch with us directly. Alternatively, email editorial-team (at) simplywallst.com.
This article by Simply Wall St is general in nature. We provide commentary based on historical data and analyst forecasts only using an unbiased methodology and our articles are not intended to be financial advice. It does not constitute a recommendation to buy or sell any stock, and does not take account of your objectives, or your financial situation. We aim to bring you long-term focused analysis driven by fundamental data. Note that our analysis may not factor in the latest price-sensitive company announcements or qualitative material. Simply Wall St has no position in any stocks mentioned.
