
 Yahoo Finance
 Honeywell (HON) Q4 Earnings Beat Estimates, Revenues Miss
Honeywell International Inc. HON reported mixed fourth-quarter 2019 results, wherein earnings beat estimates but revenues lagged the same.
Earnings & Revenues
Adjusted earnings were $2.06 per share, surpassing the Zacks Consensus Estimate of $2.04. The bottom line also jumped 11% year over year, driven by organic sales growth.
Honeywell reported adjusted earnings of $8.16 in 2019, an increase of 10% from the prior year.
Honeywell’s fourth-quarter revenues came in at $9,496 million, missing the consensus estimate of $9,589 million. Also, the top line declined 2.4% year over year. The fall was primarily attributable to the impact of spin-offs of some of the company’s businesses in 2018. However, revenues increased 2% organically on the back of solid demand for commercial fire and building management products, strength in its aerospace business, and broad-based growth in process solutions business.
In 2019, the company generated total revenues of $36,709 million compared with $41,802 million in the previous year.
Honeywell International Inc. Price, Consensus and EPS Surprise
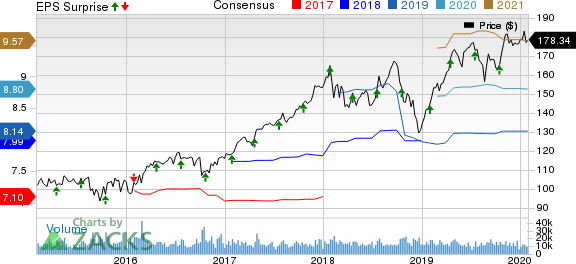
Honeywell International Inc. price-consensus-eps-surprise-chart | Honeywell International Inc. Quote
Segmental Breakup
Aerospace’s revenues were $3,661 million, up 7% year over year. Honeywell Building Technologies revenues declined 19% to $1,463 million. Performance Materials and Technologies generated $2,857 million, up 2%, while Safety and Productivity Solutions revenues declined 11% to $1,515 million.
Costs/Margins
The company’s total cost of sales in the reported quarter was $6,328 million, down 5.3% year over year. Selling, general and administrative expenses declined 3.3% to $1,473 million. Interest expenses and other financial charges were $91 million compared with $90 million a year ago.
Operating income margin in the fourth quarter was 17.8%, up 220 basis points.
Balance Sheet/Cash Flow
Exiting 2019, Honeywell had cash and cash equivalents of $9,067 million compared with $9,287 million as of Dec 31, 2018. Long-term debt was $11,110 million, higher than $9,756 million recorded at the end of 2018.
During the fourth quarter, the company generated $2,614 million cash from operating activities, higher than $1,559 million a year ago. Capital expenditure was $335 million compared with $306 million incurred in fourth-quarter 2018.
Adjusted free cash flow was $2,292 million, up 54.2%.
Outlook
Honeywell expects its near-term revenues and profitability to rise on the back of robust demand environment in commercial aerospace business. It expects greater operational excellence and stock buybacks to boost profitability.
Backed by these positives, the company has given bullish full-year 2020 earnings guidance. Earnings are currently anticipated to lie within the $8.60-$9.00 per share range. The company projects 2020 revenues between $36.7 billion and $37.8 billion (estimating organic growth of 0-3% year over year).
Zacks Rank & Stocks to Consider
Honeywell currently carries a Zacks Rank #3 (Hold).
Some better-ranked stocks are Actuant Corporation EPAC, Barnes Group, Inc. B and Berry Global Group, Inc. BERY. All these companies carry a Zacks Rank #2 (Buy). You can see the complete list of today’s Zacks #1 Rank (Strong Buy) stocks here.
Actuant pulled off positive earnings surprise of 18.57%, on average, in the trailing four quarters.
Barnes Group delivered earnings surprise of 4.21%, on average, in the trailing four quarters.
Berry Global pulled off positive earnings surprise of 0.70%, on average, in the trailing four quarters.
Today's Best Stocks from Zacks
Would you like to see the updated picks from our best market-beating strategies? From 2017 through 2019, while the S&P 500 gained and impressive +53.6%, five of our strategies returned +65.8%, +97.1%, +118.0%, +175.7% and even +186.7%.
This outperformance has not just been a recent phenomenon. From 2000 – 2019, while the S&P averaged +6.0% per year, our top strategies averaged up to +54.7% per year.
See their latest picks free >>
Want the latest recommendations from Zacks Investment Research? Today, you can download 7 Best Stocks for the Next 30 Days. Click to get this free report
Berry Global Group, Inc. (BERY) : Free Stock Analysis Report
Honeywell International Inc. (HON) : Free Stock Analysis Report
Barnes Group, Inc. (B) : Free Stock Analysis Report
Actuant Corporation (EPAC) : Free Stock Analysis Report
To read this article on Zacks.com click here.
Zacks Investment Research
