
 Yahoo Finance
 The Honest Company, Inc.'s (NASDAQ:HNST) Revenues Are Not Doing Enough For Some Investors
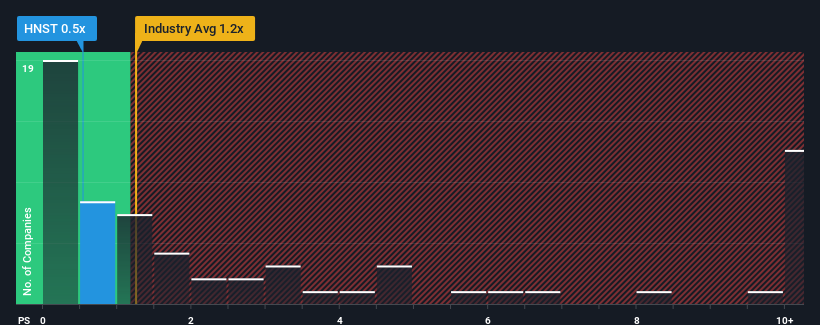
With a price-to-sales (or "P/S") ratio of 0.5x The Honest Company, Inc. (NASDAQ:HNST) may be sending bullish signals at the moment, given that almost half of all the Personal Products companies in the United States have P/S ratios greater than 1.2x and even P/S higher than 6x are not unusual. Although, it's not wise to just take the P/S at face value as there may be an explanation why it's limited.
Check out our latest analysis for Honest Company
What Does Honest Company's P/S Mean For Shareholders?
The recently shrinking revenue for Honest Company has been in line with the industry. It might be that many expect the company's revenue performance to degrade further, which has repressed the P/S. You'd much rather the company continue improving its revenue if you still believe in the business. In saying that, existing shareholders may feel hopeful about the share price if the company's revenue continues tracking the industry.
Keen to find out how analysts think Honest Company's future stacks up against the industry? In that case, our free report is a great place to start.
Do Revenue Forecasts Match The Low P/S Ratio?
In order to justify its P/S ratio, Honest Company would need to produce sluggish growth that's trailing the industry.
Taking a look back first, the company's revenue growth last year wasn't something to get excited about as it posted a disappointing decline of 1.6%. However, a few very strong years before that means that it was still able to grow revenue by an impressive 33% in total over the last three years. Although it's been a bumpy ride, it's still fair to say the revenue growth recently has been more than adequate for the company.
Looking ahead now, revenue is anticipated to climb by 4.5% each year during the coming three years according to the six analysts following the company. Meanwhile, the rest of the industry is forecast to expand by 9.6% each year, which is noticeably more attractive.
With this information, we can see why Honest Company is trading at a P/S lower than the industry. It seems most investors are expecting to see limited future growth and are only willing to pay a reduced amount for the stock.
What We Can Learn From Honest Company's P/S?
While the price-to-sales ratio shouldn't be the defining factor in whether you buy a stock or not, it's quite a capable barometer of revenue expectations.
As we suspected, our examination of Honest Company's analyst forecasts revealed that its inferior revenue outlook is contributing to its low P/S. Shareholders' pessimism on the revenue prospects for the company seems to be the main contributor to the depressed P/S. It's hard to see the share price rising strongly in the near future under these circumstances.
Don't forget that there may be other risks. For instance, we've identified 4 warning signs for Honest Company that you should be aware of.
If strong companies turning a profit tickle your fancy, then you'll want to check out this free list of interesting companies that trade on a low P/E (but have proven they can grow earnings).
Have feedback on this article? Concerned about the content? Get in touch with us directly. Alternatively, email editorial-team (at) simplywallst.com.
This article by Simply Wall St is general in nature. We provide commentary based on historical data and analyst forecasts only using an unbiased methodology and our articles are not intended to be financial advice. It does not constitute a recommendation to buy or sell any stock, and does not take account of your objectives, or your financial situation. We aim to bring you long-term focused analysis driven by fundamental data. Note that our analysis may not factor in the latest price-sensitive company announcements or qualitative material. Simply Wall St has no position in any stocks mentioned.
Join A Paid User Research Session
You’ll receive a US$30 Amazon Gift card for 1 hour of your time while helping us build better investing tools for the individual investors like yourself. Sign up here
