
 Yahoo Finance
 Are HiTech Group Australia Limited's (ASX:HIT) Fundamentals Good Enough to Warrant Buying Given The Stock's Recent Weakness?
With its stock down 9.1% over the past three months, it is easy to disregard HiTech Group Australia (ASX:HIT). However, stock prices are usually driven by a company’s financials over the long term, which in this case look pretty respectable. Particularly, we will be paying attention to HiTech Group Australia's ROE today.
Return on Equity or ROE is a test of how effectively a company is growing its value and managing investors’ money. Put another way, it reveals the company's success at turning shareholder investments into profits.
Check out our latest analysis for HiTech Group Australia
How Do You Calculate Return On Equity?
The formula for ROE is:
Return on Equity = Net Profit (from continuing operations) ÷ Shareholders' Equity
So, based on the above formula, the ROE for HiTech Group Australia is:
56% = AU$4.0m ÷ AU$7.0m (Based on the trailing twelve months to December 2021).
The 'return' is the income the business earned over the last year. That means that for every A$1 worth of shareholders' equity, the company generated A$0.56 in profit.
What Has ROE Got To Do With Earnings Growth?
So far, we've learned that ROE is a measure of a company's profitability. We now need to evaluate how much profit the company reinvests or "retains" for future growth which then gives us an idea about the growth potential of the company. Assuming all else is equal, companies that have both a higher return on equity and higher profit retention are usually the ones that have a higher growth rate when compared to companies that don't have the same features.
A Side By Side comparison of HiTech Group Australia's Earnings Growth And 56% ROE
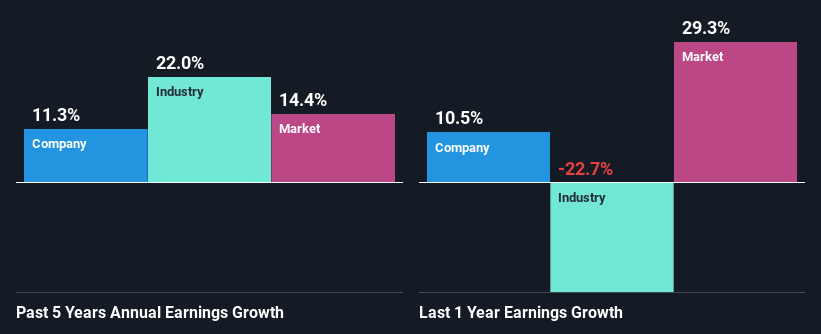
Firstly, we acknowledge that HiTech Group Australia has a significantly high ROE. Second, a comparison with the average ROE reported by the industry of 12% also doesn't go unnoticed by us. This probably laid the groundwork for HiTech Group Australia's moderate 11% net income growth seen over the past five years.
Next, on comparing with the industry net income growth, we found that HiTech Group Australia's reported growth was lower than the industry growth of 22% in the same period, which is not something we like to see.
Earnings growth is an important metric to consider when valuing a stock. It’s important for an investor to know whether the market has priced in the company's expected earnings growth (or decline). By doing so, they will have an idea if the stock is headed into clear blue waters or if swampy waters await. If you're wondering about HiTech Group Australia's's valuation, check out this gauge of its price-to-earnings ratio, as compared to its industry.
Is HiTech Group Australia Efficiently Re-investing Its Profits?
The high three-year median payout ratio of 98% (or a retention ratio of 1.7%) for HiTech Group Australia suggests that the company's growth wasn't really hampered despite it returning most of its income to its shareholders.
Additionally, HiTech Group Australia has paid dividends over a period of nine years which means that the company is pretty serious about sharing its profits with shareholders.
Conclusion
Overall, we feel that HiTech Group Australia certainly does have some positive factors to consider. As noted earlier, its earnings growth has been quite decent, and the high ROE does contribute to that growth. Still, the company invests little to almost none of its profits. This could potentially reduce the odds that the company continues to see the same level of growth in the future. Until now, we have only just grazed the surface of the company's past performance by looking at the company's fundamentals. You can do your own research on HiTech Group Australia and see how it has performed in the past by looking at this FREE detailed graph of past earnings, revenue and cash flows.
Have feedback on this article? Concerned about the content? Get in touch with us directly. Alternatively, email editorial-team (at) simplywallst.com.
This article by Simply Wall St is general in nature. We provide commentary based on historical data and analyst forecasts only using an unbiased methodology and our articles are not intended to be financial advice. It does not constitute a recommendation to buy or sell any stock, and does not take account of your objectives, or your financial situation. We aim to bring you long-term focused analysis driven by fundamental data. Note that our analysis may not factor in the latest price-sensitive company announcements or qualitative material. Simply Wall St has no position in any stocks mentioned.
