A "Historic" Bear Move Setting up in NZD/JPY
Talking Points:
Fundamental Factors Impacting NZD/JPY
A Multi-Decade Peak Looming Nearby
How to Trade a Move of This Magnitude
The 25-basis-point (bp) cash rate upgrade by the Reserve Bank of New Zealand (RBNZ) on March 13, although “telegraphed” by the RBNZ and largely expected by the markets, acknowledged the strength of the New Zealand dollar (NZD) against its currency counterparts, and was also intended to combat inflationary pressures and rising Kiwi commodity prices (especially dairy).
RBNZ Governor Graeme Wheeler said that further rate hikes would be dependent on economic data, and although another rate hike is expected at this month’s meeting (April 23), it is not yet certain that other rate hikes will follow. This begs the question of whether the impact of future RBNZ rate hikes has already been priced in by the market.
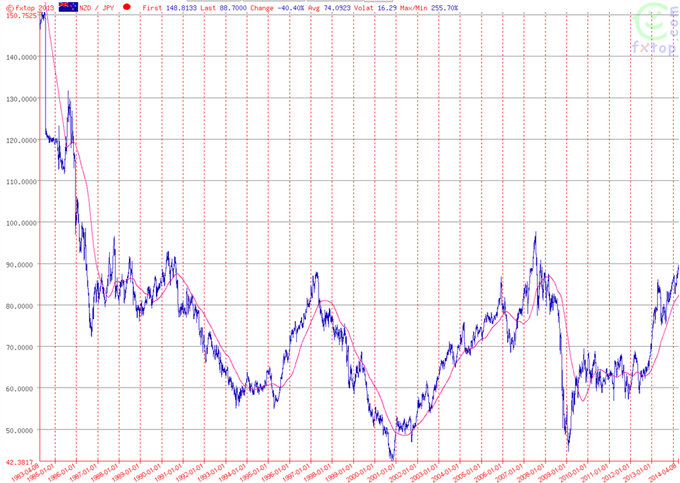
Looking at the below chart (courtesy of FXTop.com), which shows 30 years’ worth of price action in NZDJPY, we immediately notice that the 100.00 mark has been respected since the beginning of 1986. Further down, the key psychological price level (90.00) has only been pierced once since 1991, making this a very significant level as well.
This year, at the start of April, NZDJPY rose within striking distance of the key 90.00 level on the back of a bullish wave that originated in September 2012. Looking at the chart, however, we see that the current NZDJPY price level (running just shy of 88.00) is exactly the same level as the 1997 peak (87.99), which was also the site of a massive reversal that ultimately produced the all-time low of 42.38 in NZDJPY.
Guest Commentary: Long-Term Price Action in NZD/JPY
There are different ways to interpret this price action, but this could be especially appealing for long- and medium-term traders alike when we further assess the previous three reversals in NZDJPY.
If measured from peak to trough, these moves span 3,796 pips (1990 - 1993), 4,561 pips (1997 - 2000), and 5,311 pips (2007 - 2009), respectively. The average of these three reversals is a momentous 4,556 pips, and considering NZDJPY has begun a slight bear move from just shy of the key 90.00 level (although this is by no means a confirmed downtrend), another such reversal would target the 44.44 level, which is slightly below the 2009 low.
Each of the three historic bear moves has been larger than the previous one, with the second exceeding the first by 765 pips, and the third outpacing the second by 750 pips. Averaging these out and adding in the value of the last bear move would give a massive potential down move as large as (757 + 5,311) 6,068 pips!
As such, if beginning from the 90.00 level, a reversal of that magnitude would produce a low of 29.32, which would blow away the previous all-time low in NZDJPY.
How to Trade a Move of This Magnitude
Given that the first two bear moves each took about four years to complete, and the third one about two years, we can draw a Fibonacci retracement trend line from each peak to each trough and then use the derived levels to break things down to yearly targets, if not monthly ones.
Unfortunately, most trading software will not stretch back further than the early 2000’s for NZDJPY, which leaves only the last of the three reversals (the 2007 high to the 2009 low) for assessment.
As the monthly chart below shows, the 76% retracement would be around 85.00, the 61% around 77.00, and the 50% around 71.00. This would help provide closer targets to work from, and to confirm each time whether the large-scale reversal was maturing as anticipated. It would also give valuable confirmation at each level, which would help traders add to longer-term short positions if looking to scale in gradually.
Guest Commentary: Key Fibonacci Levels and Slow Stochastics for NZD/JPY
The January 2013 candle on the above monthly chart shows that price occupied the space between the 50% and 61% levels for the entire month, meaning that these price levels are definitely to be watched.
However, other levels do exist, including the 69.00 area, which acted as support between 2004 and 2006, and then served as resistance between 2010 and 2012. As a result, drawing further lines on the chart will aid in the sub-division of the huge range into smaller-sized targets, especially for the placement of stop and limit orders.
An initial short signal has already been triggered in that the 90.00 level has been rejected, and Slow Stochastics (15, 5, 5 settings) have already shown the blue line crossing the red to the downside.
Furthermore, the current peak in SSD is lower than that of a year ago, signaling a divergence with the bullish trend on the chart. We are already short from today, with the first target set just above the 76% retracement (around 85.00). The overall risk profile of this trade is an even 1:1.
By Francesco Sani, Guest Contributor, DailyFX.com
DailyFX provides forex news and technical analysis on the trends that influence the global currency markets.
Learn forex trading with a free practice account and trading charts from FXCM.

 Yahoo Finance


