
 Yahoo Finance
 Highwoods (HIW) Q1 FFO Beats Estimates, Revenues Rise Y/Y
Highwoods Properties Inc. HIW reported first-quarter 2023 funds from operations (FFO) per share of 98 cents, surpassing the Zacks Consensus Estimate of 93 cents. The same also beat our estimate of 91 cents.
The company’s quarterly results reflect rent growth. However, a fall in occupancy and higher operating expenses acted as dampeners. The company also revised its outlook for 2023.
Rental and other revenues came in at $212.8 million, narrowly missing the Zacks Consensus Estimate of $213 million. Our estimate for the quarterly revenues was pegged at $209.4 million.
On a year-over-year basis, although rental and other revenues improved 3.1%, FFO per share fell 4.9%.
According to Ted Klinck, president and CEO of HIW, “Based on our solid first-quarter results, we are pleased to update our outlook for 2023, which includes an increase in FFO and same property cash NOI growth at the respective midpoints.”
Quarter in Detail
Highwoods leased 522,000 square feet of second-generation office space in the first quarter, including 220,000 square feet of new leases. Moreover, the present development pipeline, which covers around 1.6 million square feet, aggregates $518 million (at HIW share). It is 21.8% pre-leased on a dollar-weighted basis.
Operating expenses were $148.8 million, up 2.9% on a year-over-year basis. We estimated the same to be $154.9 million.
The average in-place cash rent was up 3% per square foot from the prior-year quarter, while the dollar-weighted average term was 5.6 years.
At the end of the reported quarter, HIW’s in-service portfolio occupancy declined 150 basis points year over year to 89.6%. We projected the same to be 90.7%.
The same-property cash net operating income (NOI) increased marginally year over year to $136.8 million.
During the first quarter, Highwoods disposed of a 0.2-acre non-core land parcel for $1.9 million in Nashville.
Balance-Sheet Position
The company exited the first quarter with $15.7 million of cash and cash equivalents, down from $21.4 million reported as of Dec 31, 2022.
The reported net debt-to-adjusted EBITDAre ratio was 5.92 compared with 5.88 at the end of Dec 31, 2022.
Revised 2023 Guidance
Highwoods revised its guidance for 2023.
The company now predicts FFO per share to lie in the range of $3.68-$3.82, revised from the prior guided range of $3.66-$3.82. The Zacks Consensus Estimate for the same is currently pegged at $3.77, which lies within the guided range.
HIW expects same-property cash NOI, excluding termination fees and the net impact of temporary rent deferrals for the current year, to be between -0.5% and 1%, revised from -1%-1% projected earlier. The year-end occupancy projection is maintained in the band of 89-91%.
Highwoods currently carries a Zacks Rank #3 (Hold). You can see the complete list of today’s Zacks #1 Rank (Strong Buy) stocks here.
Highwoods Properties, Inc. Price, Consensus and EPS Surprise
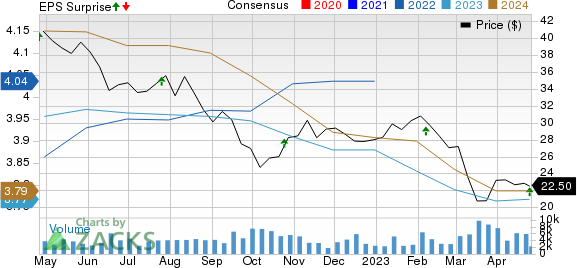
Highwoods Properties, Inc. price-consensus-eps-surprise-chart | Highwoods Properties, Inc. Quote
Performance of Other REITs
SL Green Realty Corp. SLG reported first-quarter 2023 FFO per share of $1.53, surpassing the Zacks Consensus Estimate of $1.42. It also beat our estimate of $1.39. The reported figure, however, fell 7.3% from the year-ago quarter’s $1.65.
SLG’s results reflected better-than-anticipated revenues. However, a fall in occupancy in Manhattan’s same-store office portfolio was a deterrent for the company in the first quarter.
Crown Castle Inc. CCI reported first-quarter 2023 adjusted FFO (AFFO) per share of $1.91, missing the Zacks Consensus Estimate of $1.94. The figure, however, compared favorably with the year-ago period’s $1.87. Our estimate for the same was pegged at $1.98.
Higher operating expenses in the quarter were a deterrent. Nonetheless, the rise in site-rental revenues amid elevated tower space demand aided CCI’s year-over-year top-line growth. The company maintained its outlook for 2023.
Alexandria Real Estate Equities, Inc. ARE reported first-quarter 2023 AFFO per share of $2.19, surpassing the Zacks Consensus Estimate of $2.15. The reported figure climbed 6.8% from the year-ago quarter’s tally. We estimated AFFO per share for the quarter to be $2.14.
ARE’s results reflected better-than-anticipated revenues on healthy leasing activity and solid rental rate growth.
Note: Anything related to earnings presented in this write-up represent FFO — a widely used metric to gauge the performance of REITs.
Want the latest recommendations from Zacks Investment Research? Today, you can download 7 Best Stocks for the Next 30 Days. Click to get this free report
Highwoods Properties, Inc. (HIW) : Free Stock Analysis Report
Crown Castle Inc. (CCI) : Free Stock Analysis Report
SL Green Realty Corporation (SLG) : Free Stock Analysis Report
Alexandria Real Estate Equities, Inc. (ARE) : Free Stock Analysis Report
