
 Yahoo Finance
 Here's Why We're Watching Lepidico's (ASX:LPD) Cash Burn Situation
We can readily understand why investors are attracted to unprofitable companies. For example, although Amazon.com made losses for many years after listing, if you had bought and held the shares since 1999, you would have made a fortune. Having said that, unprofitable companies are risky because they could potentially burn through all their cash and become distressed.
So should Lepidico (ASX:LPD) shareholders be worried about its cash burn? In this article, we define cash burn as its annual (negative) free cash flow, which is the amount of money a company spends each year to fund its growth. First, we'll determine its cash runway by comparing its cash burn with its cash reserves.
Check out our latest analysis for Lepidico
When Might Lepidico Run Out Of Money?
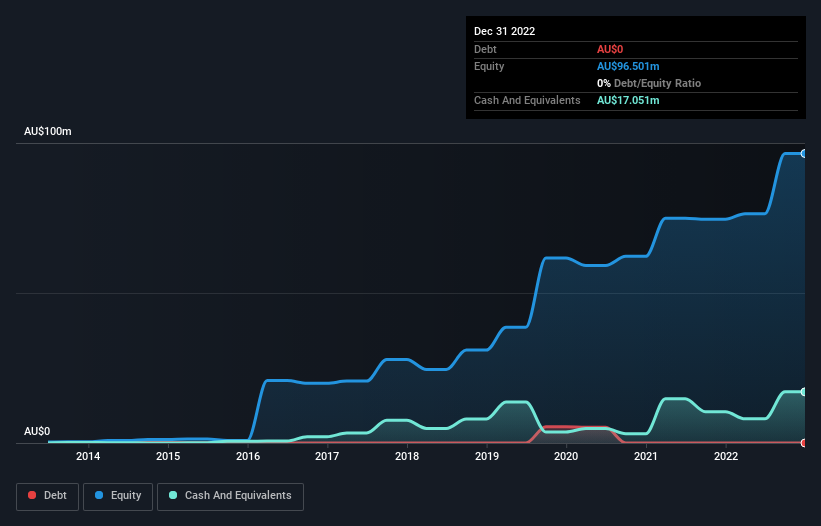
A company's cash runway is calculated by dividing its cash hoard by its cash burn. In December 2022, Lepidico had AU$17m in cash, and was debt-free. Importantly, its cash burn was AU$19m over the trailing twelve months. Therefore, from December 2022 it had roughly 11 months of cash runway. That's quite a short cash runway, indicating the company must either reduce its annual cash burn or replenish its cash. However, if we extrapolate the company's recent cash burn trend, then it would have a longer cash run way. You can see how its cash balance has changed over time in the image below.
How Is Lepidico's Cash Burn Changing Over Time?
While Lepidico did record statutory revenue of AU$2.3k over the last year, it didn't have any revenue from operations. That means we consider it a pre-revenue business, and we will focus our growth analysis on cash burn, for now. The skyrocketing cash burn up 107% year on year certainly tests our nerves. That sort of spending growth rate can't continue for very long before it causes balance sheet weakness, generally speaking. While the past is always worth studying, it is the future that matters most of all. So you might want to take a peek at how much the company is expected to grow in the next few years.
Can Lepidico Raise More Cash Easily?
Given its cash burn trajectory, Lepidico shareholders should already be thinking about how easy it might be for it to raise further cash in the future. Issuing new shares, or taking on debt, are the most common ways for a listed company to raise more money for its business. Commonly, a business will sell new shares in itself to raise cash and drive growth. By looking at a company's cash burn relative to its market capitalisation, we gain insight on how much shareholders would be diluted if the company needed to raise enough cash to cover another year's cash burn.
Since it has a market capitalisation of AU$84m, Lepidico's AU$19m in cash burn equates to about 22% of its market value. That's not insignificant, and if the company had to sell enough shares to fund another year's growth at the current share price, you'd likely witness fairly costly dilution.
How Risky Is Lepidico's Cash Burn Situation?
Lepidico is not in a great position when it comes to its cash burn situation. While its cash burn relative to its market cap wasn't too bad, its increasing cash burn does leave us rather nervous. Summing up, we think the Lepidico's cash burn is a risk, based on the factors we mentioned in this article. Taking a deeper dive, we've spotted 8 warning signs for Lepidico you should be aware of, and 2 of them don't sit too well with us.
Of course, you might find a fantastic investment by looking elsewhere. So take a peek at this free list of interesting companies, and this list of stocks growth stocks (according to analyst forecasts)
Have feedback on this article? Concerned about the content? Get in touch with us directly. Alternatively, email editorial-team (at) simplywallst.com.
This article by Simply Wall St is general in nature. We provide commentary based on historical data and analyst forecasts only using an unbiased methodology and our articles are not intended to be financial advice. It does not constitute a recommendation to buy or sell any stock, and does not take account of your objectives, or your financial situation. We aim to bring you long-term focused analysis driven by fundamental data. Note that our analysis may not factor in the latest price-sensitive company announcements or qualitative material. Simply Wall St has no position in any stocks mentioned.
