
 Yahoo Finance
 Here's Why We're Not Too Worried About Celcuity's (NASDAQ:CELC) Cash Burn Situation

Even when a business is losing money, it's possible for shareholders to make money if they buy a good business at the right price. For example, although Amazon.com made losses for many years after listing, if you had bought and held the shares since 1999, you would have made a fortune. But the harsh reality is that very many loss making companies burn through all their cash and go bankrupt.
So should Celcuity (NASDAQ:CELC) shareholders be worried about its cash burn? In this report, we will consider the company's annual negative free cash flow, henceforth referring to it as the 'cash burn'. We'll start by comparing its cash burn with its cash reserves in order to calculate its cash runway.
View our latest analysis for Celcuity
When Might Celcuity Run Out Of Money?
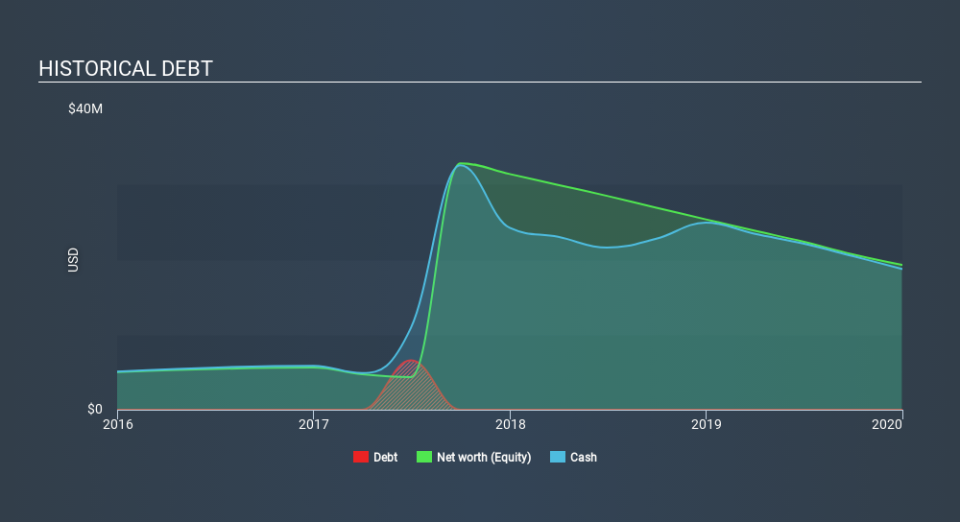
A company's cash runway is calculated by dividing its cash hoard by its cash burn. In December 2019, Celcuity had US$19m in cash, and was debt-free. In the last year, its cash burn was US$6.4m. Therefore, from December 2019 it had 2.9 years of cash runway. Arguably, that's a prudent and sensible length of runway to have. Depicted below, you can see how its cash holdings have changed over time.
How Is Celcuity's Cash Burn Changing Over Time?
Celcuity didn't record any revenue over the last year, indicating that it's an early stage company still developing its business. Nonetheless, we can still examine its cash burn trajectory as part of our assessment of its cash burn situation. As it happens, the company's cash burn reduced by 4.9% over the last year, which suggests that management are maintaining a fairly steady rate of business development, albeit with a slight decrease in spending. While the past is always worth studying, it is the future that matters most of all. For that reason, it makes a lot of sense to take a look at our analyst forecasts for the company.
Can Celcuity Raise More Cash Easily?
While Celcuity is showing a solid reduction in its cash burn, it's still worth considering how easily it could raise more cash, even just to fuel faster growth. Companies can raise capital through either debt or equity. Commonly, a business will sell new shares in itself to raise cash to drive growth. By looking at a company's cash burn relative to its market capitalisation, we gain insight on how much shareholders would be diluted if the company needed to raise enough cash to cover another year's cash burn.
Since it has a market capitalisation of US$61m, Celcuity's US$6.4m in cash burn equates to about 10% of its market value. As a result, we'd venture that the company could raise more cash for growth without much trouble, albeit at the cost of some dilution.
How Risky Is Celcuity's Cash Burn Situation?
It may already be apparent to you that we're relatively comfortable with the way Celcuity is burning through its cash. In particular, we think its cash runway stands out as evidence that the company is well on top of its spending. Its weak point is its cash burn reduction, but even that wasn't too bad! Looking at all the measures in this article, together, we're not worried about its rate of cash burn; the company seems well on top of its medium-term spending needs. Taking a deeper dive, we've spotted 4 warning signs for Celcuity you should be aware of, and 1 of them is a bit concerning.
If you would prefer to check out another company with better fundamentals, then do not miss this free list of interesting companies, that have HIGH return on equity and low debt or this list of stocks which are all forecast to grow.
If you spot an error that warrants correction, please contact the editor at editorial-team@simplywallst.com. This article by Simply Wall St is general in nature. It does not constitute a recommendation to buy or sell any stock, and does not take account of your objectives, or your financial situation. Simply Wall St has no position in the stocks mentioned.
We aim to bring you long-term focused research analysis driven by fundamental data. Note that our analysis may not factor in the latest price-sensitive company announcements or qualitative material. Thank you for reading.
