
 Yahoo Finance
 Here's Why We're Not At All Concerned With AML3D's (ASX:AL3) Cash Burn Situation
We can readily understand why investors are attracted to unprofitable companies. For example, although software-as-a-service business Salesforce.com lost money for years while it grew recurring revenue, if you held shares since 2005, you'd have done very well indeed. But the harsh reality is that very many loss making companies burn through all their cash and go bankrupt.
So, the natural question for AML3D (ASX:AL3) shareholders is whether they should be concerned by its rate of cash burn. For the purpose of this article, we'll define cash burn as the amount of cash the company is spending each year to fund its growth (also called its negative free cash flow). We'll start by comparing its cash burn with its cash reserves in order to calculate its cash runway.
See our latest analysis for AML3D
When Might AML3D Run Out Of Money?
A company's cash runway is calculated by dividing its cash hoard by its cash burn. When AML3D last reported its balance sheet in June 2021, it had zero debt and cash worth AU$7.3m. Importantly, its cash burn was AU$2.0m over the trailing twelve months. So it had a cash runway of about 3.6 years from June 2021. There's no doubt that this is a reassuringly long runway. You can see how its cash balance has changed over time in the image below.
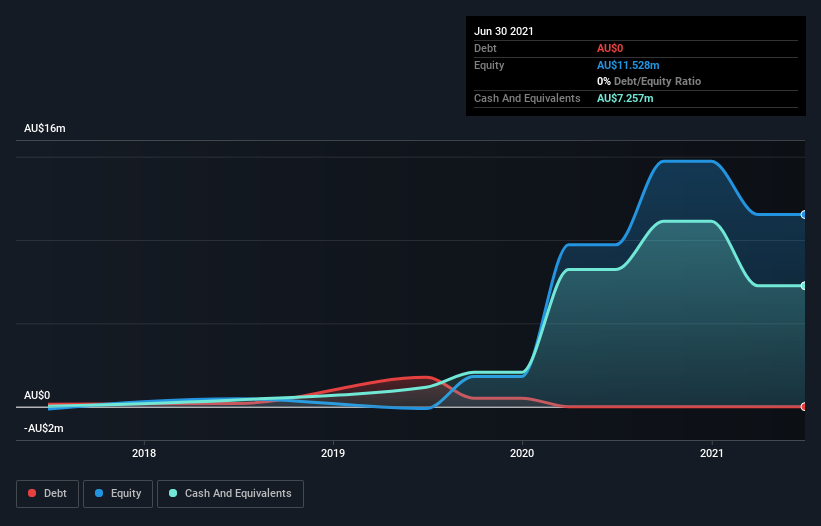
How Is AML3D's Cash Burn Changing Over Time?
In our view, AML3D doesn't yet produce significant amounts of operating revenue, since it reported just AU$644k in the last twelve months. Therefore, for the purposes of this analysis we'll focus on how the cash burn is tracking. Even though it doesn't get us excited, the 34% reduction in cash burn year on year does suggest the company can continue operating for quite some time. Admittedly, we're a bit cautious of AML3D due to its lack of significant operating revenues. So we'd generally prefer stocks from this list of stocks that have analysts forecasting growth.
How Easily Can AML3D Raise Cash?
While AML3D is showing a solid reduction in its cash burn, it's still worth considering how easily it could raise more cash, even just to fuel faster growth. Companies can raise capital through either debt or equity. Many companies end up issuing new shares to fund future growth. By comparing a company's annual cash burn to its total market capitalisation, we can estimate roughly how many shares it would have to issue in order to run the company for another year (at the same burn rate).
Since it has a market capitalisation of AU$28m, AML3D's AU$2.0m in cash burn equates to about 7.2% of its market value. Given that is a rather small percentage, it would probably be really easy for the company to fund another year's growth by issuing some new shares to investors, or even by taking out a loan.
So, Should We Worry About AML3D's Cash Burn?
As you can probably tell by now, we're not too worried about AML3D's cash burn. For example, we think its cash runway suggests that the company is on a good path. Its cash burn reduction wasn't quite as good, but was still rather encouraging! After taking into account the various metrics mentioned in this report, we're pretty comfortable with how the company is spending its cash, as it seems on track to meet its needs over the medium term. On another note, AML3D has 5 warning signs (and 2 which are a bit unpleasant) we think you should know about.
Of course AML3D may not be the best stock to buy. So you may wish to see this free collection of companies boasting high return on equity, or this list of stocks that insiders are buying.
This article by Simply Wall St is general in nature. We provide commentary based on historical data and analyst forecasts only using an unbiased methodology and our articles are not intended to be financial advice. It does not constitute a recommendation to buy or sell any stock, and does not take account of your objectives, or your financial situation. We aim to bring you long-term focused analysis driven by fundamental data. Note that our analysis may not factor in the latest price-sensitive company announcements or qualitative material. Simply Wall St has no position in any stocks mentioned.
Have feedback on this article? Concerned about the content? Get in touch with us directly. Alternatively, email editorial-team (at) simplywallst.com.
