
 Yahoo Finance
 Here's Why UCW (ASX:UCW) Has A Meaningful Debt Burden
Warren Buffett famously said, 'Volatility is far from synonymous with risk.' So it might be obvious that you need to consider debt, when you think about how risky any given stock is, because too much debt can sink a company. We note that UCW Limited (ASX:UCW) does have debt on its balance sheet. But the more important question is: how much risk is that debt creating?
What Risk Does Debt Bring?
Debt assists a business until the business has trouble paying it off, either with new capital or with free cash flow. If things get really bad, the lenders can take control of the business. While that is not too common, we often do see indebted companies permanently diluting shareholders because lenders force them to raise capital at a distressed price. Having said that, the most common situation is where a company manages its debt reasonably well - and to its own advantage. When we think about a company's use of debt, we first look at cash and debt together.
See our latest analysis for UCW
What Is UCW's Net Debt?
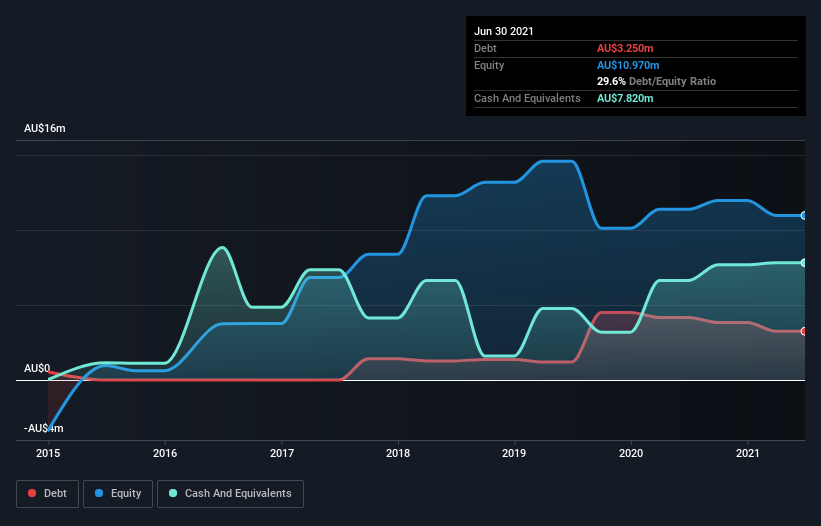
The image below, which you can click on for greater detail, shows that UCW had debt of AU$3.25m at the end of June 2021, a reduction from AU$4.17m over a year. But it also has AU$7.82m in cash to offset that, meaning it has AU$4.57m net cash.
How Strong Is UCW's Balance Sheet?
According to the last reported balance sheet, UCW had liabilities of AU$11.4m due within 12 months, and liabilities of AU$17.4m due beyond 12 months. Offsetting this, it had AU$7.82m in cash and AU$1.40m in receivables that were due within 12 months. So its liabilities total AU$19.6m more than the combination of its cash and short-term receivables.
Given this deficit is actually higher than the company's market capitalization of AU$16.5m, we think shareholders really should watch UCW's debt levels, like a parent watching their child ride a bike for the first time. Hypothetically, extremely heavy dilution would be required if the company were forced to pay down its liabilities by raising capital at the current share price. Given that UCW has more cash than debt, we're pretty confident it can handle its debt, despite the fact that it has a lot of liabilities in total.
Importantly, UCW's EBIT fell a jaw-dropping 70% in the last twelve months. If that decline continues then paying off debt will be harder than selling foie gras at a vegan convention. When analysing debt levels, the balance sheet is the obvious place to start. But it is UCW's earnings that will influence how the balance sheet holds up in the future. So when considering debt, it's definitely worth looking at the earnings trend. Click here for an interactive snapshot.
Finally, while the tax-man may adore accounting profits, lenders only accept cold hard cash. UCW may have net cash on the balance sheet, but it is still interesting to look at how well the business converts its earnings before interest and tax (EBIT) to free cash flow, because that will influence both its need for, and its capacity to manage debt. Happily for any shareholders, UCW actually produced more free cash flow than EBIT over the last three years. That sort of strong cash generation warms our hearts like a puppy in a bumblebee suit.
Summing up
While UCW does have more liabilities than liquid assets, it also has net cash of AU$4.57m. And it impressed us with free cash flow of AU$4.7m, being 281% of its EBIT. Despite the cash, we do find UCW's EBIT growth rate concerning, so we're not particularly comfortable with the stock. The balance sheet is clearly the area to focus on when you are analysing debt. However, not all investment risk resides within the balance sheet - far from it. For example - UCW has 1 warning sign we think you should be aware of.
If you're interested in investing in businesses that can grow profits without the burden of debt, then check out this free list of growing businesses that have net cash on the balance sheet.
This article by Simply Wall St is general in nature. We provide commentary based on historical data and analyst forecasts only using an unbiased methodology and our articles are not intended to be financial advice. It does not constitute a recommendation to buy or sell any stock, and does not take account of your objectives, or your financial situation. We aim to bring you long-term focused analysis driven by fundamental data. Note that our analysis may not factor in the latest price-sensitive company announcements or qualitative material. Simply Wall St has no position in any stocks mentioned.
Have feedback on this article? Concerned about the content? Get in touch with us directly. Alternatively, email editorial-team (at) simplywallst.com.
