
 Yahoo Finance
 Here's How P/E Ratios Can Help Us Understand Aurelia Metals Limited (ASX:AMI)
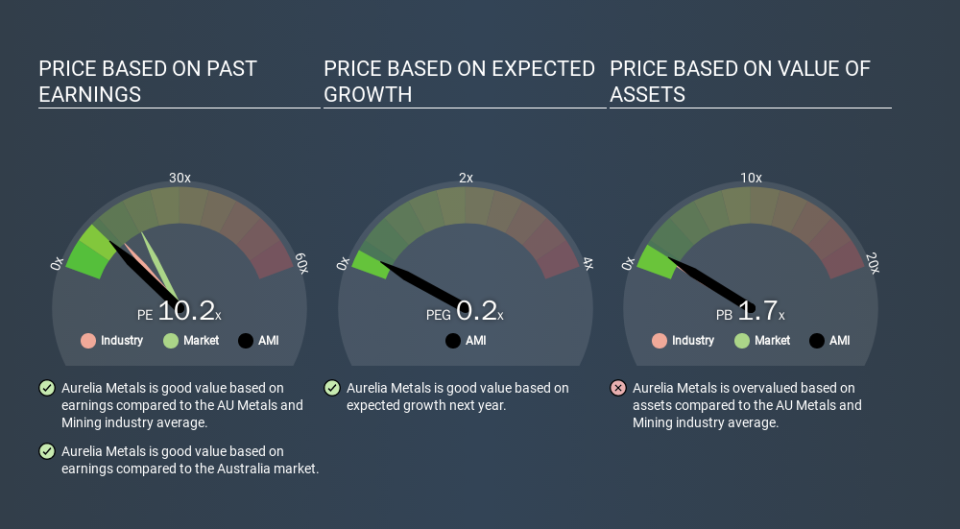
This article is written for those who want to get better at using price to earnings ratios (P/E ratios). We'll look at Aurelia Metals Limited's (ASX:AMI) P/E ratio and reflect on what it tells us about the company's share price. Looking at earnings over the last twelve months, Aurelia Metals has a P/E ratio of 10.21. That is equivalent to an earnings yield of about 9.8%.
Check out our latest analysis for Aurelia Metals
How Do You Calculate A P/E Ratio?
The formula for P/E is:
Price to Earnings Ratio = Share Price ÷ Earnings per Share (EPS)
Or for Aurelia Metals:
P/E of 10.21 = AUD0.42 ÷ AUD0.04 (Based on the trailing twelve months to June 2019.)
Is A High P/E Ratio Good?
A higher P/E ratio means that buyers have to pay a higher price for each AUD1 the company has earned over the last year. That isn't a good or a bad thing on its own, but a high P/E means that buyers have a higher opinion of the business's prospects, relative to stocks with a lower P/E.
How Does Aurelia Metals's P/E Ratio Compare To Its Peers?
The P/E ratio indicates whether the market has higher or lower expectations of a company. The image below shows that Aurelia Metals has a lower P/E than the average (12.5) P/E for companies in the metals and mining industry.
This suggests that market participants think Aurelia Metals will underperform other companies in its industry. While current expectations are low, the stock could be undervalued if the situation is better than the market assumes. It is arguably worth checking if insiders are buying shares, because that might imply they believe the stock is undervalued.
How Growth Rates Impact P/E Ratios
Probably the most important factor in determining what P/E a company trades on is the earnings growth. If earnings are growing quickly, then the 'E' in the equation will increase faster than it would otherwise. Therefore, even if you pay a high multiple of earnings now, that multiple will become lower in the future. A lower P/E should indicate the stock is cheap relative to others -- and that may attract buyers.
Aurelia Metals shrunk earnings per share by 73% over the last year. But EPS is up 14% over the last 3 years.
Remember: P/E Ratios Don't Consider The Balance Sheet
Don't forget that the P/E ratio considers market capitalization. In other words, it does not consider any debt or cash that the company may have on the balance sheet. Theoretically, a business can improve its earnings (and produce a lower P/E in the future) by investing in growth. That means taking on debt (or spending its cash).
While growth expenditure doesn't always pay off, the point is that it is a good option to have; but one that the P/E ratio ignores.
So What Does Aurelia Metals's Balance Sheet Tell Us?
Aurelia Metals has net cash of AU$104m. This is fairly high at 28% of its market capitalization. That might mean balance sheet strength is important to the business, but should also help push the P/E a bit higher than it would otherwise be.
The Verdict On Aurelia Metals's P/E Ratio
Aurelia Metals's P/E is 10.2 which is below average (18.8) in the AU market. The recent drop in earnings per share would make investors cautious, but the net cash position means the company has time to improve: if so, the low P/E could be an opportunity.
Investors have an opportunity when market expectations about a stock are wrong. As value investor Benjamin Graham famously said, 'In the short run, the market is a voting machine but in the long run, it is a weighing machine. So this free visual report on analyst forecasts could hold the key to an excellent investment decision.
But note: Aurelia Metals may not be the best stock to buy. So take a peek at this free list of interesting companies with strong recent earnings growth (and a P/E ratio below 20).
If you spot an error that warrants correction, please contact the editor at editorial-team@simplywallst.com. This article by Simply Wall St is general in nature. It does not constitute a recommendation to buy or sell any stock, and does not take account of your objectives, or your financial situation. Simply Wall St has no position in the stocks mentioned.
We aim to bring you long-term focused research analysis driven by fundamental data. Note that our analysis may not factor in the latest price-sensitive company announcements or qualitative material. Thank you for reading.
