
 Yahoo Finance
 Here's How P/E Ratios Can Help Us Understand Maxim Integrated Products, Inc. (NASDAQ:MXIM)
This article is written for those who want to get better at using price to earnings ratios (P/E ratios). We'll apply a basic P/E ratio analysis to Maxim Integrated Products, Inc.'s (NASDAQ:MXIM), to help you decide if the stock is worth further research. Maxim Integrated Products has a P/E ratio of 20.13, based on the last twelve months. In other words, at today's prices, investors are paying $20.13 for every $1 in prior year profit.
See our latest analysis for Maxim Integrated Products
How Do You Calculate Maxim Integrated Products's P/E Ratio?
The formula for P/E is:
Price to Earnings Ratio = Price per Share ÷ Earnings per Share (EPS)
Or for Maxim Integrated Products:
P/E of 20.13 = $56.74 ÷ $2.82 (Based on the year to September 2019.)
Is A High P/E Ratio Good?
A higher P/E ratio implies that investors pay a higher price for the earning power of the business. That isn't necessarily good or bad, but a high P/E implies relatively high expectations of what a company can achieve in the future.
Does Maxim Integrated Products Have A Relatively High Or Low P/E For Its Industry?
We can get an indication of market expectations by looking at the P/E ratio. If you look at the image below, you can see Maxim Integrated Products has a lower P/E than the average (30.3) in the semiconductor industry classification.
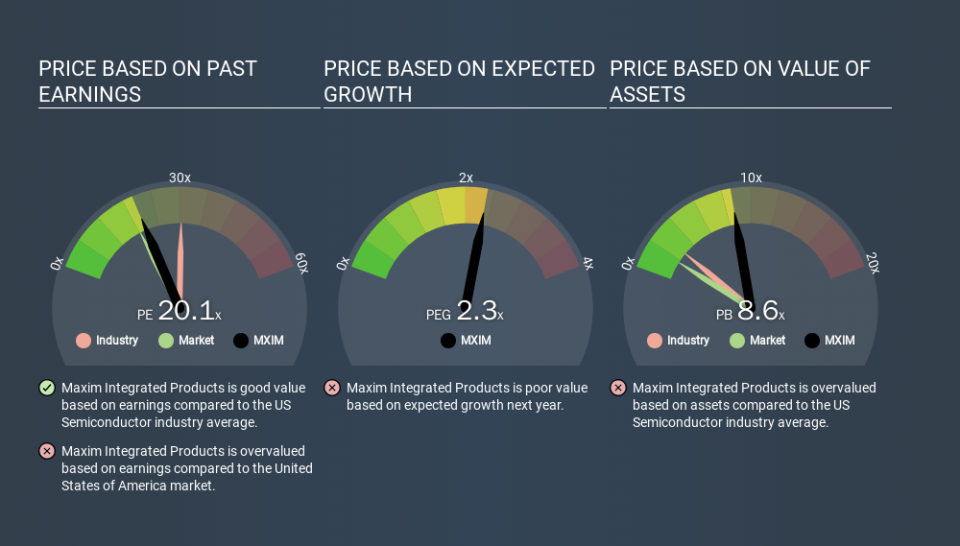
Maxim Integrated Products's P/E tells us that market participants think it will not fare as well as its peers in the same industry. Many investors like to buy stocks when the market is pessimistic about their prospects. You should delve deeper. I like to check if company insiders have been buying or selling.
How Growth Rates Impact P/E Ratios
Generally speaking the rate of earnings growth has a profound impact on a company's P/E multiple. If earnings are growing quickly, then the 'E' in the equation will increase faster than it would otherwise. Therefore, even if you pay a high multiple of earnings now, that multiple will become lower in the future. And as that P/E ratio drops, the company will look cheap, unless its share price increases.
In the last year, Maxim Integrated Products grew EPS like Taylor Swift grew her fan base back in 2010; the 55% gain was both fast and well deserved. The sweetener is that the annual five year growth rate of 18% is also impressive. So I'd be surprised if the P/E ratio was not above average.
Don't Forget: The P/E Does Not Account For Debt or Bank Deposits
It's important to note that the P/E ratio considers the market capitalization, not the enterprise value. In other words, it does not consider any debt or cash that the company may have on the balance sheet. Hypothetically, a company could reduce its future P/E ratio by spending its cash (or taking on debt) to achieve higher earnings.
Such expenditure might be good or bad, in the long term, but the point here is that the balance sheet is not reflected by this ratio.
So What Does Maxim Integrated Products's Balance Sheet Tell Us?
Maxim Integrated Products has net cash of US$800m. That should lead to a higher P/E than if it did have debt, because its strong balance sheets gives it more options.
The Bottom Line On Maxim Integrated Products's P/E Ratio
Maxim Integrated Products trades on a P/E ratio of 20.1, which is above its market average of 18.3. Its net cash position is the cherry on top of its superb EPS growth. To us, this is the sort of company that we would expect to carry an above average price tag (relative to earnings).
Investors have an opportunity when market expectations about a stock are wrong. If the reality for a company is better than it expects, you can make money by buying and holding for the long term. So this free visualization of the analyst consensus on future earnings could help you make the right decision about whether to buy, sell, or hold.
Of course you might be able to find a better stock than Maxim Integrated Products. So you may wish to see this free collection of other companies that have grown earnings strongly.
If you spot an error that warrants correction, please contact the editor at editorial-team@simplywallst.com. This article by Simply Wall St is general in nature. It does not constitute a recommendation to buy or sell any stock, and does not take account of your objectives, or your financial situation. Simply Wall St has no position in the stocks mentioned.
We aim to bring you long-term focused research analysis driven by fundamental data. Note that our analysis may not factor in the latest price-sensitive company announcements or qualitative material. Thank you for reading.
