
 Yahoo Finance
 Here's How P/E Ratios Can Help Us Understand Extended Stay America, Inc. (NASDAQ:STAY)

This article is written for those who want to get better at using price to earnings ratios (P/E ratios). We'll look at Extended Stay America, Inc.'s (NASDAQ:STAY) P/E ratio and reflect on what it tells us about the company's share price. Looking at earnings over the last twelve months, Extended Stay America has a P/E ratio of 13.04. That corresponds to an earnings yield of approximately 7.7%.
View our latest analysis for Extended Stay America
How Do You Calculate A P/E Ratio?
The formula for P/E is:
Price to Earnings Ratio = Price per Share ÷ Earnings per Share (EPS)
Or for Extended Stay America:
P/E of 13.04 = $14.05 ÷ $1.08 (Based on the trailing twelve months to June 2019.)
Is A High P/E Ratio Good?
A higher P/E ratio implies that investors pay a higher price for the earning power of the business. That is not a good or a bad thing per se, but a high P/E does imply buyers are optimistic about the future.
How Does Extended Stay America's P/E Ratio Compare To Its Peers?
The P/E ratio essentially measures market expectations of a company. We can see in the image below that the average P/E (23.5) for companies in the hospitality industry is higher than Extended Stay America's P/E.
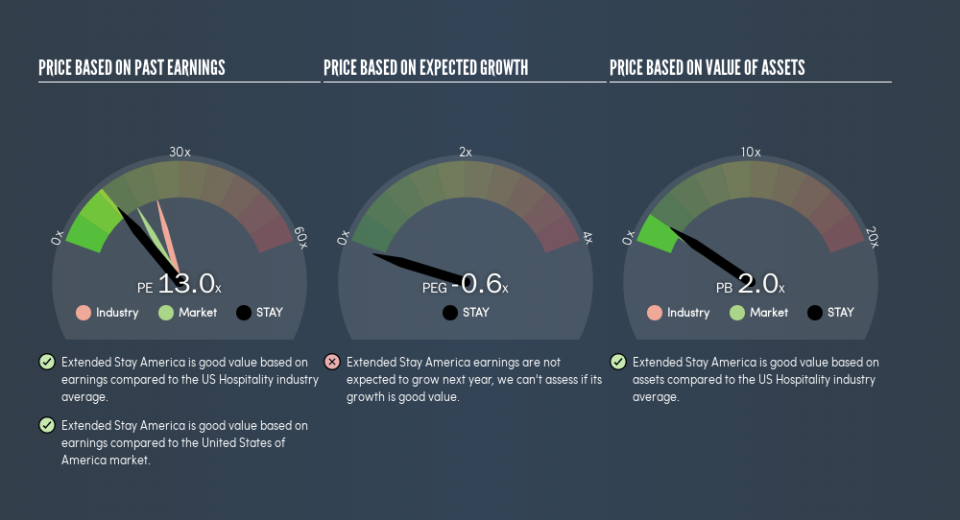
This suggests that market participants think Extended Stay America will underperform other companies in its industry. While current expectations are low, the stock could be undervalued if the situation is better than the market assumes. It is arguably worth checking if insiders are buying shares, because that might imply they believe the stock is undervalued.
How Growth Rates Impact P/E Ratios
Companies that shrink earnings per share quickly will rapidly decrease the 'E' in the equation. That means even if the current P/E is low, it will increase over time if the share price stays flat. A higher P/E should indicate the stock is expensive relative to others -- and that may encourage shareholders to sell.
Extended Stay America maintained roughly steady earnings over the last twelve months. But EPS is up 17% over the last 5 years. And EPS is down 6.3% a year, over the last 3 years. So it would be surprising to see a high P/E.
Don't Forget: The P/E Does Not Account For Debt or Bank Deposits
Don't forget that the P/E ratio considers market capitalization. In other words, it does not consider any debt or cash that the company may have on the balance sheet. Hypothetically, a company could reduce its future P/E ratio by spending its cash (or taking on debt) to achieve higher earnings.
Such spending might be good or bad, overall, but the key point here is that you need to look at debt to understand the P/E ratio in context.
Is Debt Impacting Extended Stay America's P/E?
Extended Stay America has net debt worth 80% of its market capitalization. This is a reasonably significant level of debt -- all else being equal you'd expect a much lower P/E than if it had net cash.
The Verdict On Extended Stay America's P/E Ratio
Extended Stay America trades on a P/E ratio of 13, which is below the US market average of 17.3. It's good to see EPS growth in the last 12 months, but the debt on the balance sheet might be muting expectations.
Investors have an opportunity when market expectations about a stock are wrong. If it is underestimating a company, investors can make money by buying and holding the shares until the market corrects itself. So this free visualization of the analyst consensus on future earnings could help you make the right decision about whether to buy, sell, or hold.
But note: Extended Stay America may not be the best stock to buy. So take a peek at this free list of interesting companies with strong recent earnings growth (and a P/E ratio below 20).
We aim to bring you long-term focused research analysis driven by fundamental data. Note that our analysis may not factor in the latest price-sensitive company announcements or qualitative material.
If you spot an error that warrants correction, please contact the editor at editorial-team@simplywallst.com. This article by Simply Wall St is general in nature. It does not constitute a recommendation to buy or sell any stock, and does not take account of your objectives, or your financial situation. Simply Wall St has no position in the stocks mentioned. Thank you for reading.
