
 Yahoo Finance
 Here's What To Make Of OPAL Fuels' (NASDAQ:OPAL) Decelerating Rates Of Return
If we want to find a stock that could multiply over the long term, what are the underlying trends we should look for? Typically, we'll want to notice a trend of growing return on capital employed (ROCE) and alongside that, an expanding base of capital employed. Ultimately, this demonstrates that it's a business that is reinvesting profits at increasing rates of return. However, after briefly looking over the numbers, we don't think OPAL Fuels (NASDAQ:OPAL) has the makings of a multi-bagger going forward, but let's have a look at why that may be.
What Is Return On Capital Employed (ROCE)?
For those that aren't sure what ROCE is, it measures the amount of pre-tax profits a company can generate from the capital employed in its business. Analysts use this formula to calculate it for OPAL Fuels:
Return on Capital Employed = Earnings Before Interest and Tax (EBIT) ÷ (Total Assets - Current Liabilities)
0.018 = US$12m ÷ (US$750m - US$75m) (Based on the trailing twelve months to March 2024).
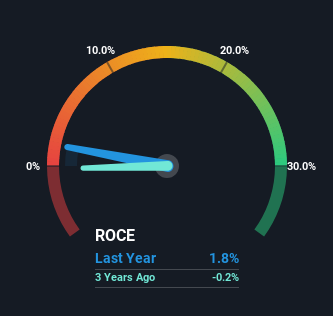
So, OPAL Fuels has an ROCE of 1.8%. In absolute terms, that's a low return and it also under-performs the Oil and Gas industry average of 13%.
See our latest analysis for OPAL Fuels
Above you can see how the current ROCE for OPAL Fuels compares to its prior returns on capital, but there's only so much you can tell from the past. If you'd like to see what analysts are forecasting going forward, you should check out our free analyst report for OPAL Fuels .
The Trend Of ROCE
The returns on capital haven't changed much for OPAL Fuels in recent years. The company has employed 478% more capital in the last four years, and the returns on that capital have remained stable at 1.8%. This poor ROCE doesn't inspire confidence right now, and with the increase in capital employed, it's evident that the business isn't deploying the funds into high return investments.
One more thing to note, even though ROCE has remained relatively flat over the last four years, the reduction in current liabilities to 10% of total assets, is good to see from a business owner's perspective. Effectively suppliers now fund less of the business, which can lower some elements of risk.
What We Can Learn From OPAL Fuels' ROCE
As we've seen above, OPAL Fuels' returns on capital haven't increased but it is reinvesting in the business. And investors appear hesitant that the trends will pick up because the stock has fallen 57% in the last three years. Therefore based on the analysis done in this article, we don't think OPAL Fuels has the makings of a multi-bagger.
OPAL Fuels could be trading at an attractive price in other respects, so you might find our free intrinsic value estimation for OPAL on our platform quite valuable.
If you want to search for solid companies with great earnings, check out this free list of companies with good balance sheets and impressive returns on equity.
Have feedback on this article? Concerned about the content? Get in touch with us directly. Alternatively, email editorial-team (at) simplywallst.com.
This article by Simply Wall St is general in nature. We provide commentary based on historical data and analyst forecasts only using an unbiased methodology and our articles are not intended to be financial advice. It does not constitute a recommendation to buy or sell any stock, and does not take account of your objectives, or your financial situation. We aim to bring you long-term focused analysis driven by fundamental data. Note that our analysis may not factor in the latest price-sensitive company announcements or qualitative material. Simply Wall St has no position in any stocks mentioned.
Have feedback on this article? Concerned about the content? Get in touch with us directly. Alternatively, email editorial-team@simplywallst.com
