
 Yahoo Finance
 Here's What To Make Of Livent's (NYSE:LTHM) Decelerating Rates Of Return
If we want to find a stock that could multiply over the long term, what are the underlying trends we should look for? In a perfect world, we'd like to see a company investing more capital into its business and ideally the returns earned from that capital are also increasing. If you see this, it typically means it's a company with a great business model and plenty of profitable reinvestment opportunities. So, when we ran our eye over Livent's (NYSE:LTHM) trend of ROCE, we liked what we saw.
What Is Return On Capital Employed (ROCE)?
For those who don't know, ROCE is a measure of a company's yearly pre-tax profit (its return), relative to the capital employed in the business. Analysts use this formula to calculate it for Livent:
Return on Capital Employed = Earnings Before Interest and Tax (EBIT) ÷ (Total Assets - Current Liabilities)
0.18 = US$338m ÷ (US$2.1b - US$149m) (Based on the trailing twelve months to December 2022).
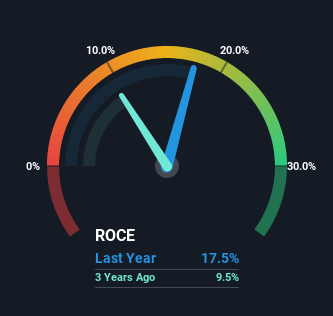
So, Livent has an ROCE of 18%. On its own, that's a standard return, however it's much better than the 11% generated by the Chemicals industry.
See our latest analysis for Livent
Above you can see how the current ROCE for Livent compares to its prior returns on capital, but there's only so much you can tell from the past. If you'd like to see what analysts are forecasting going forward, you should check out our free report for Livent.
What Does the ROCE Trend For Livent Tell Us?
While the current returns on capital are decent, they haven't changed much. The company has employed 369% more capital in the last five years, and the returns on that capital have remained stable at 18%. Since 18% is a moderate ROCE though, it's good to see a business can continue to reinvest at these decent rates of return. Stable returns in this ballpark can be unexciting, but if they can be maintained over the long run, they often provide nice rewards to shareholders.
One more thing to note, even though ROCE has remained relatively flat over the last five years, the reduction in current liabilities to 7.2% of total assets, is good to see from a business owner's perspective. Effectively suppliers now fund less of the business, which can lower some elements of risk.
Our Take On Livent's ROCE
The main thing to remember is that Livent has proven its ability to continually reinvest at respectable rates of return. And the stock has done incredibly well with a 377% return over the last three years, so long term investors are no doubt ecstatic with that result. So even though the stock might be more "expensive" than it was before, we think the strong fundamentals warrant this stock for further research.
One more thing to note, we've identified 1 warning sign with Livent and understanding it should be part of your investment process.
For those who like to invest in solid companies, check out this free list of companies with solid balance sheets and high returns on equity.
Have feedback on this article? Concerned about the content? Get in touch with us directly. Alternatively, email editorial-team (at) simplywallst.com.
This article by Simply Wall St is general in nature. We provide commentary based on historical data and analyst forecasts only using an unbiased methodology and our articles are not intended to be financial advice. It does not constitute a recommendation to buy or sell any stock, and does not take account of your objectives, or your financial situation. We aim to bring you long-term focused analysis driven by fundamental data. Note that our analysis may not factor in the latest price-sensitive company announcements or qualitative material. Simply Wall St has no position in any stocks mentioned.
Join A Paid User Research Session
You’ll receive a US$30 Amazon Gift card for 1 hour of your time while helping us build better investing tools for the individual investors like yourself. Sign up here
