
 Yahoo Finance
 Here's What Honeywell International Inc.'s (NYSE:HON) P/E Ratio Is Telling Us

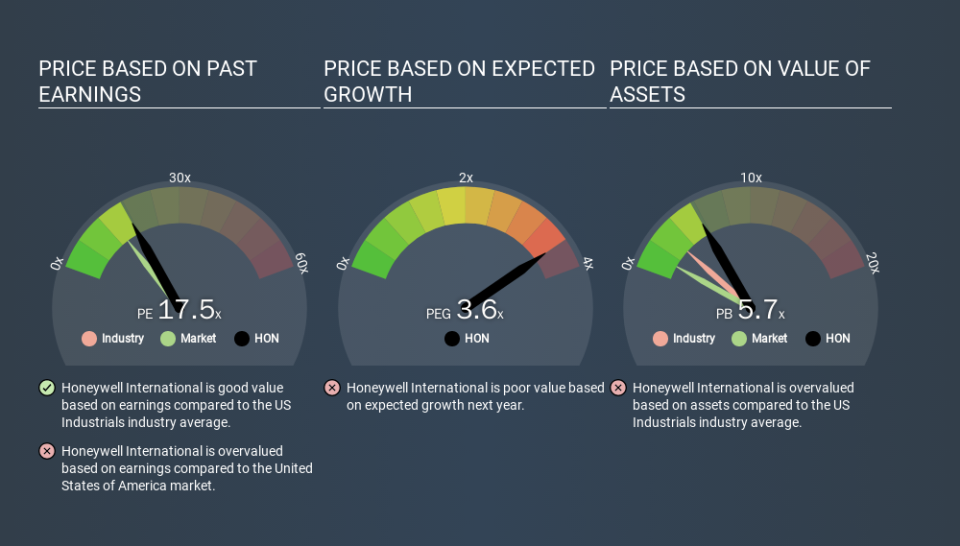
The goal of this article is to teach you how to use price to earnings ratios (P/E ratios). We'll show how you can use Honeywell International Inc.'s (NYSE:HON) P/E ratio to inform your assessment of the investment opportunity. Based on the last twelve months, Honeywell International's P/E ratio is 17.54. That is equivalent to an earnings yield of about 5.7%.
Check out our latest analysis for Honeywell International
How Do You Calculate Honeywell International's P/E Ratio?
The formula for price to earnings is:
Price to Earnings Ratio = Price per Share ÷ Earnings per Share (EPS)
Or for Honeywell International:
P/E of 17.54 = $149.410 ÷ $8.520 (Based on the trailing twelve months to December 2019.)
(Note: the above calculation results may not be precise due to rounding.)
Is A High Price-to-Earnings Ratio Good?
A higher P/E ratio means that buyers have to pay a higher price for each $1 the company has earned over the last year. That isn't necessarily good or bad, but a high P/E implies relatively high expectations of what a company can achieve in the future.
Does Honeywell International Have A Relatively High Or Low P/E For Its Industry?
We can get an indication of market expectations by looking at the P/E ratio. As you can see below Honeywell International has a P/E ratio that is fairly close for the average for the industrials industry, which is 17.9.
Honeywell International's P/E tells us that market participants think its prospects are roughly in line with its industry. If the company has better than average prospects, then the market might be underestimating it. Further research into factors such as insider buying and selling, could help you form your own view on whether that is likely.
How Growth Rates Impact P/E Ratios
Generally speaking the rate of earnings growth has a profound impact on a company's P/E multiple. That's because companies that grow earnings per share quickly will rapidly increase the 'E' in the equation. That means even if the current P/E is high, it will reduce over time if the share price stays flat. A lower P/E should indicate the stock is cheap relative to others -- and that may attract buyers.
Honeywell International shrunk earnings per share by 6.4% last year. But EPS is up 9.5% over the last 5 years.
Don't Forget: The P/E Does Not Account For Debt or Bank Deposits
It's important to note that the P/E ratio considers the market capitalization, not the enterprise value. That means it doesn't take debt or cash into account. Theoretically, a business can improve its earnings (and produce a lower P/E in the future) by investing in growth. That means taking on debt (or spending its cash).
While growth expenditure doesn't always pay off, the point is that it is a good option to have; but one that the P/E ratio ignores.
Honeywell International's Balance Sheet
Net debt totals just 5.1% of Honeywell International's market cap. So it doesn't have as many options as it would with net cash, but its debt would not have much of an impact on its P/E ratio.
The Verdict On Honeywell International's P/E Ratio
Honeywell International's P/E is 17.5 which is above average (14.0) in its market. With some debt but no EPS growth last year, the market has high expectations of future profits.
Investors have an opportunity when market expectations about a stock are wrong. People often underestimate remarkable growth -- so investors can make money when fast growth is not fully appreciated. So this free visual report on analyst forecasts could hold the key to an excellent investment decision.
Of course you might be able to find a better stock than Honeywell International. So you may wish to see this free collection of other companies that have grown earnings strongly.
If you spot an error that warrants correction, please contact the editor at editorial-team@simplywallst.com. This article by Simply Wall St is general in nature. It does not constitute a recommendation to buy or sell any stock, and does not take account of your objectives, or your financial situation. Simply Wall St has no position in the stocks mentioned.
We aim to bring you long-term focused research analysis driven by fundamental data. Note that our analysis may not factor in the latest price-sensitive company announcements or qualitative material. Thank you for reading.
