
 Yahoo Finance
 Here's What Fiducian Group Limited's (ASX:FID) P/E Is Telling Us

This article is for investors who would like to improve their understanding of price to earnings ratios (P/E ratios). We'll look at Fiducian Group Limited's (ASX:FID) P/E ratio and reflect on what it tells us about the company's share price. Based on the last twelve months, Fiducian Group's P/E ratio is 18.27. That means that at current prices, buyers pay A$18.27 for every A$1 in trailing yearly profits.
View our latest analysis for Fiducian Group
How Do I Calculate A Price To Earnings Ratio?
The formula for price to earnings is:
Price to Earnings Ratio = Price per Share ÷ Earnings per Share (EPS)
Or for Fiducian Group:
P/E of 18.27 = A$5.76 ÷ A$0.32 (Based on the trailing twelve months to December 2018.)
Is A High Price-to-Earnings Ratio Good?
A higher P/E ratio means that buyers have to pay a higher price for each A$1 the company has earned over the last year. That is not a good or a bad thing per se, but a high P/E does imply buyers are optimistic about the future.
How Does Fiducian Group's P/E Ratio Compare To Its Peers?
We can get an indication of market expectations by looking at the P/E ratio. The image below shows that Fiducian Group has a P/E ratio that is roughly in line with the capital markets industry average (18.3).
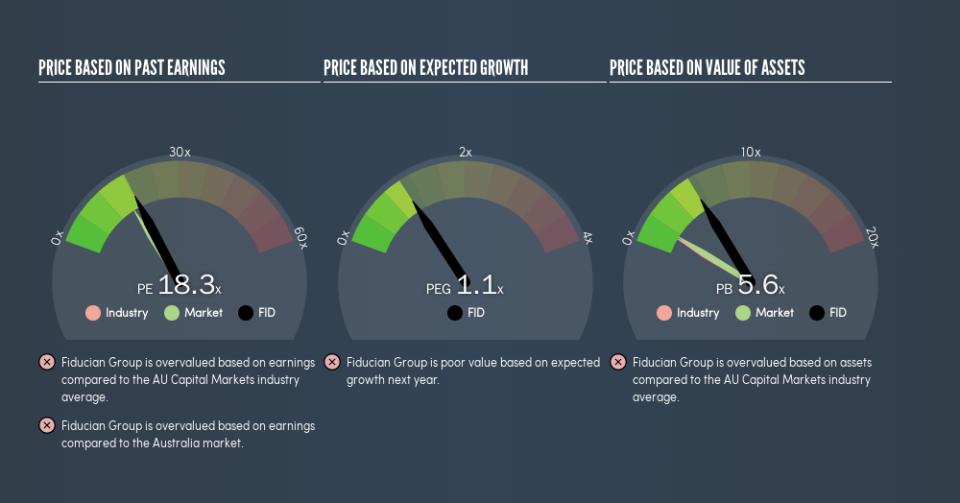
That indicates that the market expects Fiducian Group will perform roughly in line with other companies in its industry. If the company has better than average prospects, then the market might be underestimating it. Checking factors such as director buying and selling. could help you form your own view on if that will happen.
How Growth Rates Impact P/E Ratios
P/E ratios primarily reflect market expectations around earnings growth rates. When earnings grow, the 'E' increases, over time. That means unless the share price increases, the P/E will reduce in a few years. Then, a lower P/E should attract more buyers, pushing the share price up.
It's great to see that Fiducian Group grew EPS by 17% in the last year. And its annual EPS growth rate over 5 years is 23%. So one might expect an above average P/E ratio.
Remember: P/E Ratios Don't Consider The Balance Sheet
The 'Price' in P/E reflects the market capitalization of the company. So it won't reflect the advantage of cash, or disadvantage of debt. Theoretically, a business can improve its earnings (and produce a lower P/E in the future) by investing in growth. That means taking on debt (or spending its cash).
While growth expenditure doesn't always pay off, the point is that it is a good option to have; but one that the P/E ratio ignores.
Fiducian Group's Balance Sheet
Fiducian Group has net cash of AU$15m. That should lead to a higher P/E than if it did have debt, because its strong balance sheets gives it more options.
The Bottom Line On Fiducian Group's P/E Ratio
Fiducian Group trades on a P/E ratio of 18.3, which is above its market average of 16.4. With cash in the bank the company has plenty of growth options -- and it is already on the right track. So it is not surprising the market is probably extrapolating recent growth well into the future, reflected in the relatively high P/E ratio.
When the market is wrong about a stock, it gives savvy investors an opportunity. As value investor Benjamin Graham famously said, 'In the short run, the market is a voting machine but in the long run, it is a weighing machine.' So this free visualization of the analyst consensus on future earnings could help you make the right decision about whether to buy, sell, or hold.
Of course, you might find a fantastic investment by looking at a few good candidates. So take a peek at this free list of companies with modest (or no) debt, trading on a P/E below 20.
We aim to bring you long-term focused research analysis driven by fundamental data. Note that our analysis may not factor in the latest price-sensitive company announcements or qualitative material.
If you spot an error that warrants correction, please contact the editor at editorial-team@simplywallst.com. This article by Simply Wall St is general in nature. It does not constitute a recommendation to buy or sell any stock, and does not take account of your objectives, or your financial situation. Simply Wall St has no position in the stocks mentioned. Thank you for reading.
