
 Yahoo Finance
 Here's What We Like About CME Group Inc. (NASDAQ:CME)'s Upcoming Dividend

Some investors rely on dividends for growing their wealth, and if you're one of those dividend sleuths, you might be intrigued to know that CME Group Inc. (NASDAQ:CME) is about to go ex-dividend in just 4 days. This means that investors who purchase shares on or after the 9th of September will not receive the dividend, which will be paid on the 25th of September.
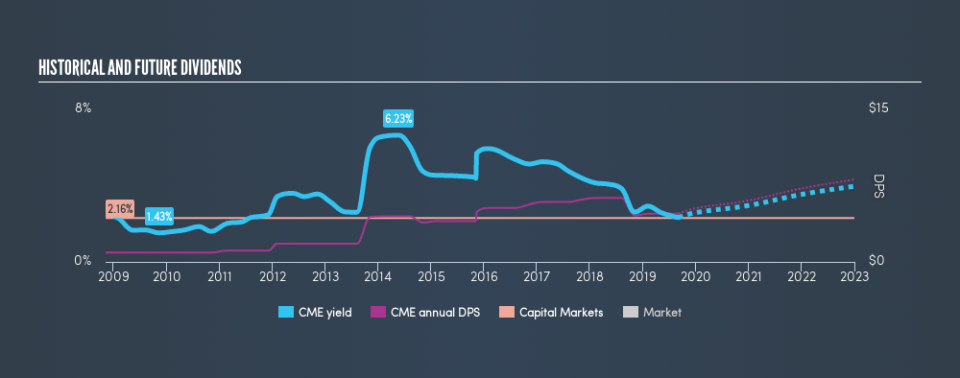
CME Group's upcoming dividend is US$0.75 a share, following on from the last 12 months, when the company distributed a total of US$4.75 per share to shareholders. Calculating the last year's worth of payments shows that CME Group has a trailing yield of 2.2% on the current share price of $217.76. We love seeing companies pay a dividend, but it's also important to be sure that laying the golden eggs isn't going to kill our golden goose! We need to see whether the dividend is covered by earnings and if it's growing.
Check out our latest analysis for CME Group
Dividends are typically paid from company earnings. If a company pays more in dividends than it earned in profit, then the dividend could be unsustainable. CME Group is paying out an acceptable 56% of its profit, a common payout level among most companies.
Companies that pay out less in dividends than they earn in profits generally have more sustainable dividends. The lower the payout ratio, the more wiggle room the business has before it could be forced to cut the dividend.
Click here to see the company's payout ratio, plus analyst estimates of its future dividends.
Have Earnings And Dividends Been Growing?
Stocks in companies that generate sustainable earnings growth often make the best dividend prospects, as it is easier to lift the dividend when earnings are rising. If earnings fall far enough, the company could be forced to cut its dividend. For this reason, we're glad to see CME Group's earnings per share have risen 12% per annum over the last five years.
The main way most investors will assess a company's dividend prospects is by checking the historical rate of dividend growth. CME Group has delivered 18% dividend growth per year on average over the past 10 years. It's great to see earnings per share growing rapidly over several years, and dividends per share growing right along with it.
The Bottom Line
From a dividend perspective, should investors buy or avoid CME Group? Earnings per share are growing nicely, and CME Group is paying out a percentage of its earnings that is around the average for dividend-paying stocks. In summary, CME Group appears to have some promise as a dividend stock, and we'd suggest taking a closer look at it.
Ever wonder what the future holds for CME Group? See what the 15 analysts we track are forecasting, with this visualisation of its historical and future estimated earnings and cash flow
A common investment mistake is buying the first interesting stock you see. Here you can find a list of promising dividend stocks with a greater than 2% yield and an upcoming dividend.
We aim to bring you long-term focused research analysis driven by fundamental data. Note that our analysis may not factor in the latest price-sensitive company announcements or qualitative material.
If you spot an error that warrants correction, please contact the editor at editorial-team@simplywallst.com. This article by Simply Wall St is general in nature. It does not constitute a recommendation to buy or sell any stock, and does not take account of your objectives, or your financial situation. Simply Wall St has no position in the stocks mentioned. Thank you for reading.
