
 Yahoo Finance
 Here's What The Boston Beer Company, Inc.'s (NYSE:SAM) P/E Is Telling Us

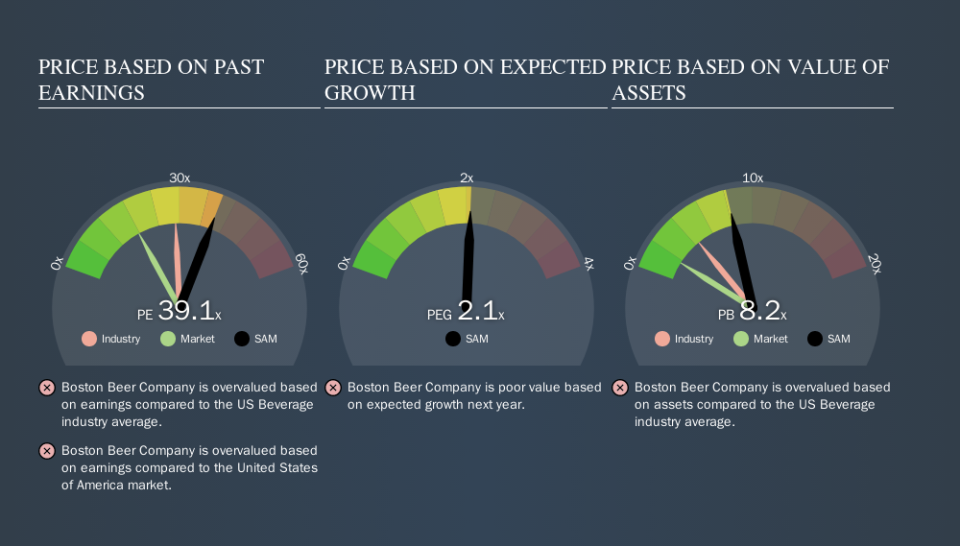
This article is for investors who would like to improve their understanding of price to earnings ratios (P/E ratios). We'll apply a basic P/E ratio analysis to The Boston Beer Company, Inc.'s (NYSE:SAM), to help you decide if the stock is worth further research. Based on the last twelve months, Boston Beer Company's P/E ratio is 39.08. In other words, at today's prices, investors are paying $39.08 for every $1 in prior year profit.
Check out our latest analysis for Boston Beer Company
How Do I Calculate A Price To Earnings Ratio?
The formula for P/E is:
Price to Earnings Ratio = Share Price ÷ Earnings per Share (EPS)
Or for Boston Beer Company:
P/E of 39.08 = $373.39 ÷ $9.56 (Based on the trailing twelve months to June 2019.)
Is A High Price-to-Earnings Ratio Good?
A higher P/E ratio implies that investors pay a higher price for the earning power of the business. All else being equal, it's better to pay a low price -- but as Warren Buffett said, 'It's far better to buy a wonderful company at a fair price than a fair company at a wonderful price.
Does Boston Beer Company Have A Relatively High Or Low P/E For Its Industry?
One good way to get a quick read on what market participants expect of a company is to look at its P/E ratio. As you can see below, Boston Beer Company has a higher P/E than the average company (29.2) in the beverage industry.
Its relatively high P/E ratio indicates that Boston Beer Company shareholders think it will perform better than other companies in its industry classification. Shareholders are clearly optimistic, but the future is always uncertain. So investors should always consider the P/E ratio alongside other factors, such as whether company directors have been buying shares.
How Growth Rates Impact P/E Ratios
P/E ratios primarily reflect market expectations around earnings growth rates. Earnings growth means that in the future the 'E' will be higher. That means even if the current P/E is high, it will reduce over time if the share price stays flat. Then, a lower P/E should attract more buyers, pushing the share price up.
Most would be impressed by Boston Beer Company earnings growth of 16% in the last year. And its annual EPS growth rate over 5 years is 9.8%. With that performance, you might expect an above average P/E ratio.
Remember: P/E Ratios Don't Consider The Balance Sheet
Don't forget that the P/E ratio considers market capitalization. That means it doesn't take debt or cash into account. Hypothetically, a company could reduce its future P/E ratio by spending its cash (or taking on debt) to achieve higher earnings.
Such expenditure might be good or bad, in the long term, but the point here is that the balance sheet is not reflected by this ratio.
How Does Boston Beer Company's Debt Impact Its P/E Ratio?
Boston Beer Company's net debt is 0.8% of its market cap. So it doesn't have as many options as it would with net cash, but its debt would not have much of an impact on its P/E ratio.
The Verdict On Boston Beer Company's P/E Ratio
Boston Beer Company's P/E is 39.1 which is above average (17.7) in its market. The company is not overly constrained by its modest debt levels, and its recent EPS growth very solid. So on this analysis it seems reasonable that its P/E ratio is above average.
Investors have an opportunity when market expectations about a stock are wrong. People often underestimate remarkable growth -- so investors can make money when fast growth is not fully appreciated. So this free visualization of the analyst consensus on future earnings could help you make the right decision about whether to buy, sell, or hold.
Of course, you might find a fantastic investment by looking at a few good candidates. So take a peek at this free list of companies with modest (or no) debt, trading on a P/E below 20.
We aim to bring you long-term focused research analysis driven by fundamental data. Note that our analysis may not factor in the latest price-sensitive company announcements or qualitative material.
If you spot an error that warrants correction, please contact the editor at editorial-team@simplywallst.com. This article by Simply Wall St is general in nature. It does not constitute a recommendation to buy or sell any stock, and does not take account of your objectives, or your financial situation. Simply Wall St has no position in the stocks mentioned. Thank you for reading.
