
 Yahoo Finance
 Update: HCP (NYSE:HCP) Stock Gained 34% In The Last Year

Want to participate in a short research study? Help shape the future of investing tools and you could win a $250 gift card!
These days it's easy to simply buy an index fund, and your returns should (roughly) match the market. But you can significantly boost your returns by picking above-average stocks. For example, the HCP, Inc. (NYSE:HCP) share price is up 34% in the last year, clearly besting than the market return of around 0.7% (not including dividends). If it can keep that out-performance up over the long term, investors will do very well! Zooming out, the stock is actually down 7.9% in the last three years.
Check out our latest analysis for HCP
There is no denying that markets are sometimes efficient, but prices do not always reflect underlying business performance. By comparing earnings per share (EPS) and share price changes over time, we can get a feel for how investor attitudes to a company have morphed over time.
HCP went from making a loss to reporting a profit, in the last year. When a company has just transitioned to profitability, earnings per share growth is not always the best way to look at the share price action.
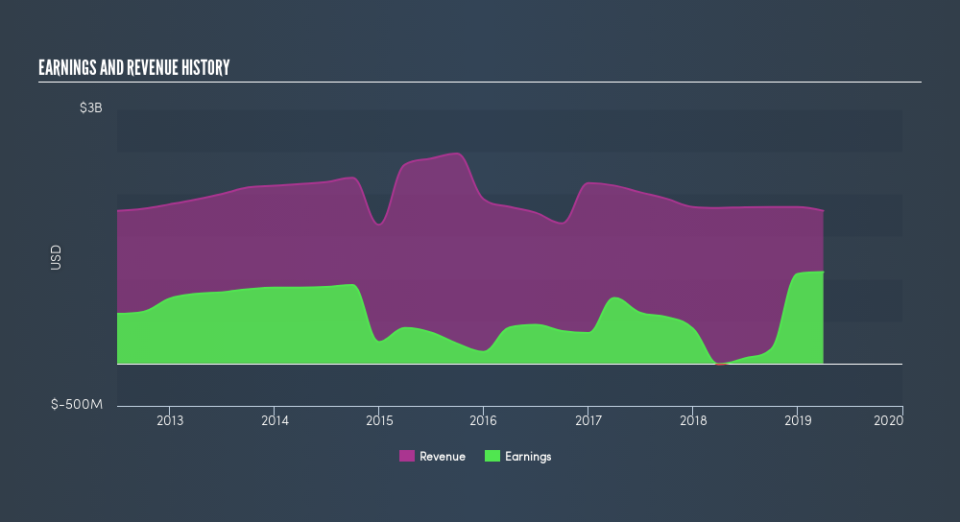
Absent any improvement, we don't think a thirst for dividends is pushing up the HCP's share price. And at a glance the languishing revenue does not impress, though a closer look might help explain the market optimism.
The graphic below shows how revenue and earnings have changed as management guided the business forward. If you want to see cashflow, you can click on the chart.
HCP is well known by investors, and plenty of clever analysts have tried to predict the future profit levels. So it makes a lot of sense to check out what analysts think HCP will earn in the future (free analyst consensus estimates)
What About Dividends?
As well as measuring the share price return, investors should also consider the total shareholder return (TSR). Whereas the share price return only reflects the change in the share price, the TSR includes the value of dividends (assuming they were reinvested) and the benefit of any discounted capital raising or spin-off. So for companies that pay a generous dividend, the TSR is often a lot higher than the share price return. In the case of HCP, it has a TSR of 41% for the last year. That exceeds its share price return that we previously mentioned. This is largely a result of its dividend payments!
A Different Perspective
It's good to see that HCP has rewarded shareholders with a total shareholder return of 41% in the last twelve months. And that does include the dividend. That's better than the annualised return of 2.5% over half a decade, implying that the company is doing better recently. Someone with an optimistic perspective could view the recent improvement in TSR as indicating that the business itself is getting better with time. If you would like to research HCP in more detail then you might want to take a look at whether insiders have been buying or selling shares in the company.
We will like HCP better if we see some big insider buys. While we wait, check out this free list of growing companies with considerable, recent, insider buying.
Please note, the market returns quoted in this article reflect the market weighted average returns of stocks that currently trade on US exchanges.
We aim to bring you long-term focused research analysis driven by fundamental data. Note that our analysis may not factor in the latest price-sensitive company announcements or qualitative material.
If you spot an error that warrants correction, please contact the editor at editorial-team@simplywallst.com. This article by Simply Wall St is general in nature. It does not constitute a recommendation to buy or sell any stock, and does not take account of your objectives, or your financial situation. Simply Wall St has no position in the stocks mentioned. Thank you for reading.
