
 Yahoo Finance
 Hawaiian Holdings (HA) Q1 Earnings & Revenues Beat Estimates
Hawaiian Holdings, HA posted first-quarter 2023 loss (excluding 26 cents from non-recurring items) of $2.17 per share which was narrower than the Zacks Consensus Estimate of a loss of $2.28. In the year-ago quarter, HA posted a loss of $2.54.
Quarterly revenues of $612.6 million improved 28.4% year over year and surpassed the Zacks Consensus Estimate of $608.3 million. A rise of 35.8% in passenger revenues on the back of upbeat air-travel demand resulted in this uptick. Notably, passenger revenues accounted for 89.5% of the top line in first-quarter 2023.
Scheduled airline traffic (measured by revenue passenger miles) increased 29.2% year over year. Scheduled capacity (measured in available seat miles or ASM) increased 15.8% year over year to 4914.6 million. The passenger load factor (percentage of seats filled by passengers) increased to 78.2% compared with 70.1% reported a year ago.
Passenger revenue per ASM or PRASM increased to 11.16 cents, witnessing a year-over-year uptick of 17.2%. Operating revenue per ASM (RASM) grew by 11.3% on a year-over-year basis.
Hawaiian Holdings, Inc. Price, Consensus and EPS Surprise
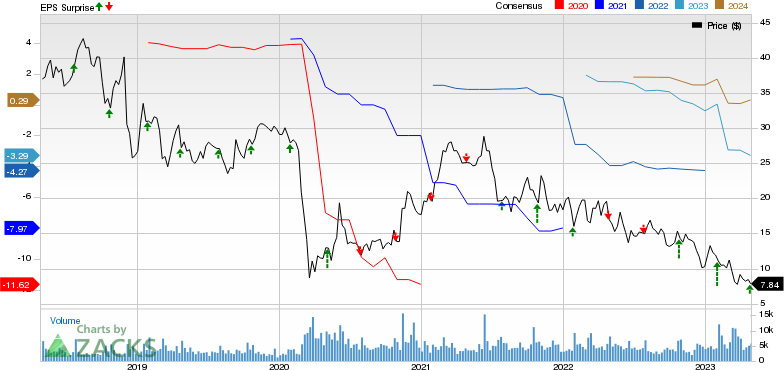
Hawaiian Holdings, Inc. price-consensus-eps-surprise-chart | Hawaiian Holdings, Inc. Quote
Average fuel cost per gallon (economic) increased 8.5% to $3.07 in the first quarter compared with the year-ago reported figure. Operating cost per ASM or CASM, excluding aircraft fuel and non-recurring items, increased 1.3% year over year to 14.85 cents at first-quarter 2023 end.
Liquidity
As of Mar 31, the company had unrestricted cash, cash equivalents and short-term investments of $1.4 billion, and outstanding debt and finance lease obligations of $1.7 billion.
Q2 2023 Outlook
RASM is expected to go down to 8.5-11.5% from the second-quarter 2022 figures.
Capacity is anticipated to increase 10.5-13.5% from second-quarter 2022 levels.
Costs per ASM (excluding fuel & non-recurring items) are expected to be in the range of being flat to up 3% from second-quarter 2022 levels.
Gallons of jet fuel consumed are expected to increase 16.5-19.5% from second-quarter 2022 level.
The effective tax rate is anticipated to be around 21% during the second quarter.
Fuel price per gallon is expected to be at $2.62 by the end of second-quarter 2023.
2023 Outlook
The below expectations are in comparison to full-year 2022 actuals.
Gallons of jet fuel consumed are now expected to increase 12.5-15.5% (prior view: 10.5-13.5%).
Fuel price per gallon is anticipated to be $2.70 (prior view: $2.92).
Hawaiian Holdings currently carries a Zacks Rank #3 (Hold). You can see the complete list of today’s Zacks #1 Rank (Strong Buy) stocks here.
Q1 Performance of Some Other Transportation Companies
J.B. Hunt Transport Services, Inc.’s JBHT first-quarter 2023 earnings of $1.89 per share missed the Zacks Consensus Estimate of $2.04 and declined 17.5% year over year.
JBHT’s total operating revenues of $3,229.58 million also lagged the Zacks Consensus Estimate of $3,434.4 million and fell 7.4% year over year. The downfall was due to declines in the volume of 25% in Integrated Capacity Solutions (ICS), 5% in Intermodal (JBI) and 17% in Final Mile Services (FMS), respectively. A decline of 17% in revenue per load in Truckload (JBT) also added to the woes.
Revenue declines in ICS, JBI, FMS and JBT were partially offset by Dedicated Contract Services revenue growth of 13%. JBHT’s total operating revenues, excluding fuel surcharges, decreased 10.2% year over year.
Delta Air Lines’ DAL first-quarter 2023 earnings (excluding 82 cents from non-recurring items) of 25 cents per share missed the Zacks Consensus Estimate of 29 cents. Volatile fuel price and unfavorable weather conditions led to this downtick. DAL reported a loss of $1.23 per share a year ago as air-travel demand was not so buoyant back then.
DAL reported revenues of $12,759 million, which missed the Zacks Consensus Estimate of $12,767.4 million. However, driven by higher air-travel demand, total revenues increased 36.49% on a year-over-year basis.
Want the latest recommendations from Zacks Investment Research? Today, you can download 7 Best Stocks for the Next 30 Days. Click to get this free report
Delta Air Lines, Inc. (DAL) : Free Stock Analysis Report
J.B. Hunt Transport Services, Inc. (JBHT) : Free Stock Analysis Report
Hawaiian Holdings, Inc. (HA) : Free Stock Analysis Report
