
 Yahoo Finance
 If You Had Bought Vishay Intertechnology (NYSE:VSH) Shares Three Years Ago You'd Have Made 71%

By buying an index fund, you can roughly match the market return with ease. But if you choose individual stocks with prowess, you can make superior returns. For example, the Vishay Intertechnology, Inc. (NYSE:VSH) share price is up 71% in the last three years, clearly besting than the market return of around 38% (not including dividends). However, more recent returns haven't been as impressive as that, with the stock returning just 12% in the last year, including dividends.
See our latest analysis for Vishay Intertechnology
To quote Buffett, 'Ships will sail around the world but the Flat Earth Society will flourish. There will continue to be wide discrepancies between price and value in the marketplace...' By comparing earnings per share (EPS) and share price changes over time, we can get a feel for how investor attitudes to a company have morphed over time.
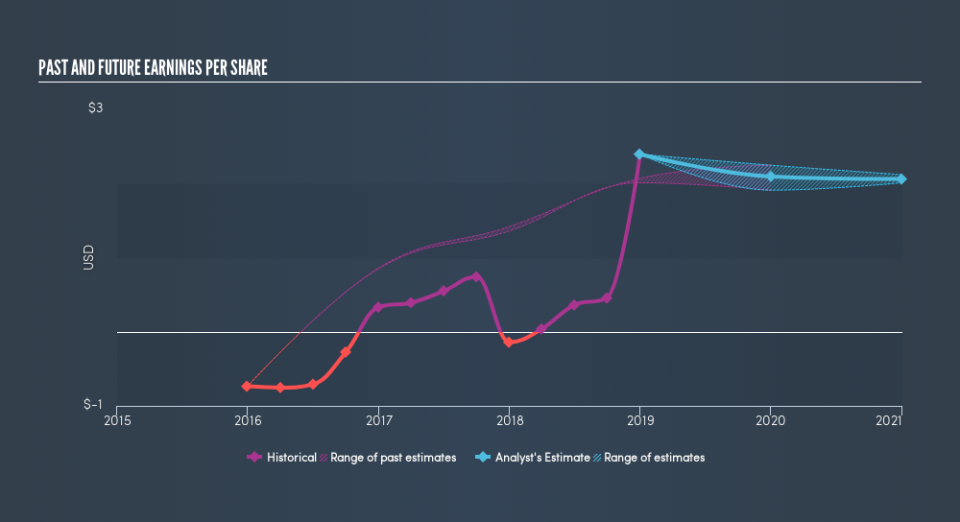
During three years of share price growth, Vishay Intertechnology moved from a loss to profitability. So we would expect a higher share price over the period.
The company's earnings per share (over time) is depicted in the image below (click to see the exact numbers).
It is of course excellent to see how Vishay Intertechnology has grown profits over the years, but the future is more important for shareholders. This free interactive report on Vishay Intertechnology's balance sheet strength is a great place to start, if you want to investigate the stock further.
What About Dividends?
When looking at investment returns, it is important to consider the difference between total shareholder return (TSR) and share price return. Whereas the share price return only reflects the change in the share price, the TSR includes the value of dividends (assuming they were reinvested) and the benefit of any discounted capital raising or spin-off. Arguably, the TSR gives a more comprehensive picture of the return generated by a stock. As it happens, Vishay Intertechnology's TSR for the last 3 years was 79%, which exceeds the share price return mentioned earlier. This is largely a result of its dividend payments!
A Different Perspective
It's nice to see that Vishay Intertechnology shareholders have received a total shareholder return of 12% over the last year. Of course, that includes the dividend. That's better than the annualised return of 8.9% over half a decade, implying that the company is doing better recently. Someone with an optimistic perspective could view the recent improvement in TSR as indicating that the business itself is getting better with time. Most investors take the time to check the data on insider transactions. You can click here to see if insiders have been buying or selling.
If you like to buy stocks alongside management, then you might just love this free list of companies. (Hint: insiders have been buying them).
Please note, the market returns quoted in this article reflect the market weighted average returns of stocks that currently trade on US exchanges.
We aim to bring you long-term focused research analysis driven by fundamental data. Note that our analysis may not factor in the latest price-sensitive company announcements or qualitative material.
If you spot an error that warrants correction, please contact the editor at editorial-team@simplywallst.com. This article by Simply Wall St is general in nature. It does not constitute a recommendation to buy or sell any stock, and does not take account of your objectives, or your financial situation. Simply Wall St has no position in the stocks mentioned. Thank you for reading.
