
 Yahoo Finance
 If You Had Bought Kimball International's (NASDAQ:KBAL) Shares A Year Ago You Would Be Down 39%

The simplest way to benefit from a rising market is to buy an index fund. While individual stocks can be big winners, plenty more fail to generate satisfactory returns. For example, the Kimball International, Inc. (NASDAQ:KBAL) share price is down 39% in the last year. That falls noticeably short of the market return of around 10%. Notably, shareholders had a tough run over the longer term, too, with a drop of 34% in the last three years. Shareholders have had an even rougher run lately, with the share price down 17% in the last 90 days.
See our latest analysis for Kimball International
To paraphrase Benjamin Graham: Over the short term the market is a voting machine, but over the long term it's a weighing machine. One imperfect but simple way to consider how the market perception of a company has shifted is to compare the change in the earnings per share (EPS) with the share price movement.
Even though the Kimball International share price is down over the year, its EPS actually improved. Of course, the situation might betray previous over-optimism about growth.
It's fair to say that the share price does not seem to be reflecting the EPS growth. But we might find some different metrics explain the share price movements better.
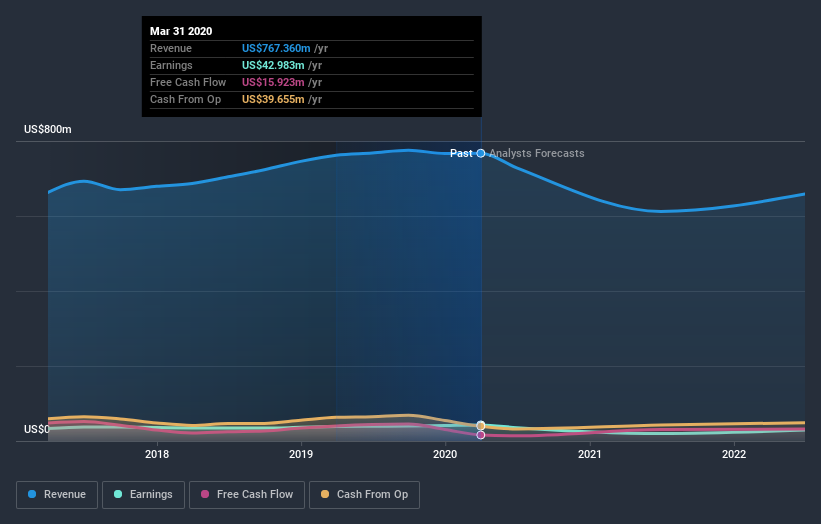
Revenue was fairly steady year on year, which isn't usually such a bad thing. But the share price might be lower because the market expected a meaningful improvement, and got none.
You can see how earnings and revenue have changed over time in the image below (click on the chart to see the exact values).
We like that insiders have been buying shares in the last twelve months. Having said that, most people consider earnings and revenue growth trends to be a more meaningful guide to the business. This free report showing analyst forecasts should help you form a view on Kimball International
What about the Total Shareholder Return (TSR)?
Investors should note that there's a difference between Kimball International's total shareholder return (TSR) and its share price change, which we've covered above. The TSR is a return calculation that accounts for the value of cash dividends (assuming that any dividend received was reinvested) and the calculated value of any discounted capital raisings and spin-offs. Kimball International's TSR of was a loss of 38% for the year. That wasn't as bad as its share price return, because it has paid dividends.
A Different Perspective
While the broader market gained around 10% in the last year, Kimball International shareholders lost 38% (even including dividends). However, keep in mind that even the best stocks will sometimes underperform the market over a twelve month period. Longer term investors wouldn't be so upset, since they would have made 0.5%, each year, over five years. If the fundamental data continues to indicate long term sustainable growth, the current sell-off could be an opportunity worth considering. While it is well worth considering the different impacts that market conditions can have on the share price, there are other factors that are even more important. Take risks, for example - Kimball International has 3 warning signs (and 2 which make us uncomfortable) we think you should know about.
If you like to buy stocks alongside management, then you might just love this free list of companies. (Hint: insiders have been buying them).
Please note, the market returns quoted in this article reflect the market weighted average returns of stocks that currently trade on US exchanges.
This article by Simply Wall St is general in nature. It does not constitute a recommendation to buy or sell any stock, and does not take account of your objectives, or your financial situation. We aim to bring you long-term focused analysis driven by fundamental data. Note that our analysis may not factor in the latest price-sensitive company announcements or qualitative material. Simply Wall St has no position in any stocks mentioned.
Have feedback on this article? Concerned about the content? Get in touch with us directly. Alternatively, email editorial-team@simplywallst.com.
