
 Yahoo Finance
 GYG plc's (LON:GYG) Dismal Stock Performance Reflects Weak Fundamentals

GYG (LON:GYG) has had a rough three months with its share price down 17%. Given that stock prices are usually driven by a company’s fundamentals over the long term, which in this case look pretty weak, we decided to study the company's key financial indicators. Specifically, we decided to study GYG's ROE in this article.
Return on Equity or ROE is a test of how effectively a company is growing its value and managing investors’ money. In other words, it is a profitability ratio which measures the rate of return on the capital provided by the company's shareholders.
View our latest analysis for GYG
How To Calculate Return On Equity?
The formula for ROE is:
Return on Equity = Net Profit (from continuing operations) ÷ Shareholders' Equity
So, based on the above formula, the ROE for GYG is:
1.4% = €186k ÷ €13m (Based on the trailing twelve months to June 2020).
The 'return' is the income the business earned over the last year. One way to conceptualize this is that for each £1 of shareholders' capital it has, the company made £0.01 in profit.
Why Is ROE Important For Earnings Growth?
So far, we've learned that ROE is a measure of a company's profitability. Based on how much of its profits the company chooses to reinvest or "retain", we are then able to evaluate a company's future ability to generate profits. Generally speaking, other things being equal, firms with a high return on equity and profit retention, have a higher growth rate than firms that don’t share these attributes.
A Side By Side comparison of GYG's Earnings Growth And 1.4% ROE
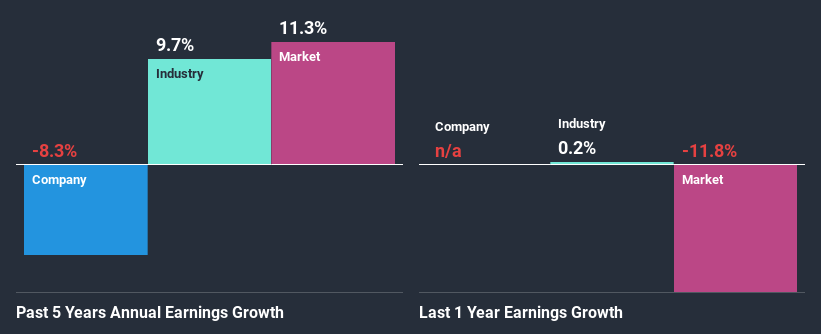
As you can see, GYG's ROE looks pretty weak. Not just that, even compared to the industry average of 11%, the company's ROE is entirely unremarkable. Therefore, it might not be wrong to say that the five year net income decline of 8.3% seen by GYG was possibly a result of it having a lower ROE. We reckon that there could also be other factors at play here. For instance, the company has a very high payout ratio, or is faced with competitive pressures.
However, when we compared GYG's growth with the industry we found that while the company's earnings have been shrinking, the industry has seen an earnings growth of 9.7% in the same period. This is quite worrisome.
The basis for attaching value to a company is, to a great extent, tied to its earnings growth. It’s important for an investor to know whether the market has priced in the company's expected earnings growth (or decline). Doing so will help them establish if the stock's future looks promising or ominous. One good indicator of expected earnings growth is the P/E ratio which determines the price the market is willing to pay for a stock based on its earnings prospects. So, you may want to check if GYG is trading on a high P/E or a low P/E, relative to its industry.
Is GYG Efficiently Re-investing Its Profits?
While the company did payout a portion of its dividend in the past, it currently doesn't pay a dividend. This implies that potentially all of its profits are being reinvested in the business.
Conclusion
Overall, we would be extremely cautious before making any decision on GYG. The company has seen a lack of earnings growth as a result of retaining very little profits and whatever little it does retain, is being reinvested at a very low rate of return. Having said that, looking at current analyst estimates, we found that the company's earnings growth rate is expected to see a huge improvement. To know more about the latest analysts predictions for the company, check out this visualization of analyst forecasts for the company.
This article by Simply Wall St is general in nature. It does not constitute a recommendation to buy or sell any stock, and does not take account of your objectives, or your financial situation. We aim to bring you long-term focused analysis driven by fundamental data. Note that our analysis may not factor in the latest price-sensitive company announcements or qualitative material. Simply Wall St has no position in any stocks mentioned.
Have feedback on this article? Concerned about the content? Get in touch with us directly. Alternatively, email editorial-team@simplywallst.com.
