
 Yahoo Finance
 Grocery Outlet (GO) Q2 Earnings Beat Estimates, FY22 View Up
Grocery Outlet Holding Corp. GO reported second-quarter 2022 results, wherein the top and bottom lines not only beat the Zacks Consensus Estimate but also improved year over year. The company registered solid comparable store sales performance in the quarter. Stellar first-half results, a strong start to the third quarter and sustained reinvestments in the business prompted management to lift the net sales and earnings view for 2022.
This California-based company continues to navigate through the challenging operating environment with strategic growth efforts. Grocery Outlet’s flexible sourcing and distribution business model, which helps it offer products at exceptional values as well as excellent service from independent operators, bodes well. The company’s opportunistic purchasing strategy, marketing efforts, store-growth endeavors and e-commerce initiatives to deepen customer reach appear encouraging.
Shares of GO have risen 26% in the past three months compared with the industry’s growth of 5.5%.
Q2 Insights
The extreme value retailer of quality, name-brand consumables and fresh products reported adjusted earnings of 29 cents a share, which surpassed the Zacks Consensus Estimate of 24 cents. The bottom line increased from the 23 cents reported in the prior-year quarter due to robust sales and gross margin expansion.
Net sales of $897.7 million beat the Zacks Consensus Estimate of $859.6 million and grew 15.7% year over year, driven by the stellar comparable store sales performance combined with the impact of 25 net new stores opened since the second quarter of 2021.
Comparable store sales increased 11.2% in the second quarter against a decline of 10% in the year-ago period. The average ticket and positive traffic trends were primary drivers behind comparable store sales growth.
Grocery Outlet Holding Corp. Price, Consensus and EPS Surprise
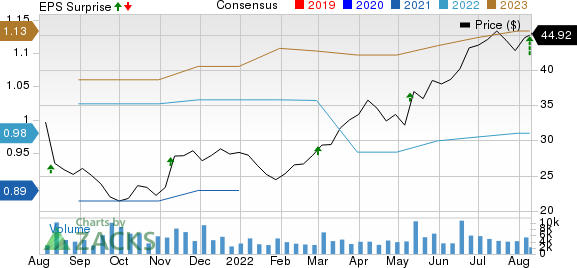
Grocery Outlet Holding Corp. price-consensus-eps-surprise-chart | Grocery Outlet Holding Corp. Quote
Margins & Costs
The gross profit jumped 17.5% year over year to $279.4 million, while the gross margin expanded 40 basis points to 31.1%. During the quarter, adjusted EBITDA rose 18.3% to $60.1 million, while the adjusted EBITDA margin increased 10 basis points to 6.7%.
SG&A expenses jumped 16.2% to $224.2 million due to increased independent operator commission expenses, higher incentive compensations and increased store occupancy costs related to the new store growth. As a percentage of net sales, SG&A expenses increased 10 basis points to 25%.
Store Update
During the quarter, Grocery Outlet opened seven new stores, thereby taking the total count to 425 stores in eight states. It remains on track to open 28 net new stores in 2022 and expects to recommence 10%-unit growth in 2023. In the third quarter, the company plans to open seven new stores.
Other Financial Aspects
Grocery Outlet, which carries a Zacks Rank #2 (Buy), ended the quarter with cash and cash equivalents of $84.3 million, long-term debt of $378.8 million and stockholders’ equity of $1,056.7 million.
Net cash provided by operating activities during the quarter was $48.4 million. The company incurred capital expenditures of $25.5 million (net of tenant improvement allowances). Management envisions capital expenditures (net of tenant improvement allowances) of about $115 million for 2022.
Outlook
Management expects 2022 net sales between $3.46 billion and $3.48 billion (versus $3.08 billion in 2021) as well as comparable store sales growth of 8% to 8.5% (against a decline of 6% in 2021).
The company earlier projected net sales in the range of $3.39 billion-$3.42 billion and a comparable store sales increase in the band of 5.5%-6.5% for 2022.
Grocery Outlet guided a full-year gross margin of 30.6% compared with the 30.8% reported in 2021. It projected adjusted EBITDA between $218 million and $223 million compared with $198.5 million in 2021. The company forecast adjusted earnings in the bracket of 97 cents-$1.00 per share for 2022, suggesting an increase from the 90 cents reported in 2021.
The company earlier forecast 2022 adjusted EBITDA between $213 million and $220 million and adjusted earnings per share in the range of 94 cents-99 cents.
Management envisions third-quarter 2022 net sales to be approximately $875 million compared with the $768.9 million reported in the third quarter of 2021. It guided comparable store sales growth of 10% against a decline of 4.3% witnessed in the prior-year quarter.
Grocery Outlet expects the third-quarter 2022 gross margin to be approximately 30.6% compared with the 30.8% reported in the year-ago period. It guided adjusted EBITDA to be in line with first-half results at approximately 6.3% of net sales. GO reported an adjusted EBITDA margin of 6.7% in the prior-year quarter. Management foresees second-half SG&A as a percentage of net sales in line with the first half.
Other Stocks Hogging the Limelight
Here we have highlighted three other similar-ranked stocks, namely Dollar General DG, Costco COST and Dollar Tree DLTR.
Dollar General, a discount retailer, currently carries a Zacks Rank #2. DG has an expected earnings per share growth rate of 12.8% for three to five years. You can see the complete list of today’s Zacks #1 Rank (Strong Buy) stocks here.
The Zacks Consensus Estimate for Dollar General’s current financial-year revenues and earnings per share suggests growth of 10% and 13.3%, respectively, from the year-ago reported figure. Dollar General has a trailing four-quarter earnings surprise of 2.8%, on average.
Costco, which is engaged in the operation of membership warehouses, carries a Zacks Rank #2. COST has an expected earnings per share growth rate of 9.2% for three to five years.
The Zacks Consensus Estimate for Costco’s current financial-year sales and earnings per share suggests growth of 15.4% and 18.2%, respectively, from the year-ago period. COST has a trailing four-quarter earnings surprise of 9.7%, on average.
Dollar Tree operates discount variety retail stores. The stock currently carries a Zacks Rank #2. DLTR has an expected earnings per share growth rate of 15.5% for three to five years.
The Zacks Consensus Estimate for Dollar Tree’s current financial-year revenues and earnings per share suggests growth of 6.7% and 40.5%, respectively, from the year-ago reported figure. DLTR has a trailing four-quarter earnings surprise of 13.1%, on average.
Want the latest recommendations from Zacks Investment Research? Today, you can download 7 Best Stocks for the Next 30 Days. Click to get this free report
Dollar General Corporation (DG) : Free Stock Analysis Report
Dollar Tree, Inc. (DLTR) : Free Stock Analysis Report
Costco Wholesale Corporation (COST) : Free Stock Analysis Report
Grocery Outlet Holding Corp. (GO) : Free Stock Analysis Report
To read this article on Zacks.com click here.
Zacks Investment Research
