
 Yahoo Finance
 Is Graco Inc.'s (NYSE:GGG) Recent Performance Tethered To Its Attractive Financial Prospects?
Graco's (NYSE:GGG) stock up by 3.8% over the past three months. Given that the market rewards strong financials in the long-term, we wonder if that is the case in this instance. In this article, we decided to focus on Graco's ROE.
Return on Equity or ROE is a test of how effectively a company is growing its value and managing investors’ money. In simpler terms, it measures the profitability of a company in relation to shareholder's equity.
See our latest analysis for Graco
How Do You Calculate Return On Equity?
ROE can be calculated by using the formula:
Return on Equity = Net Profit (from continuing operations) ÷ Shareholders' Equity
So, based on the above formula, the ROE for Graco is:
25% = US$461m ÷ US$1.9b (Based on the trailing twelve months to December 2022).
The 'return' is the amount earned after tax over the last twelve months. That means that for every $1 worth of shareholders' equity, the company generated $0.25 in profit.
What Has ROE Got To Do With Earnings Growth?
Thus far, we have learned that ROE measures how efficiently a company is generating its profits. We now need to evaluate how much profit the company reinvests or "retains" for future growth which then gives us an idea about the growth potential of the company. Assuming everything else remains unchanged, the higher the ROE and profit retention, the higher the growth rate of a company compared to companies that don't necessarily bear these characteristics.
Graco's Earnings Growth And 25% ROE
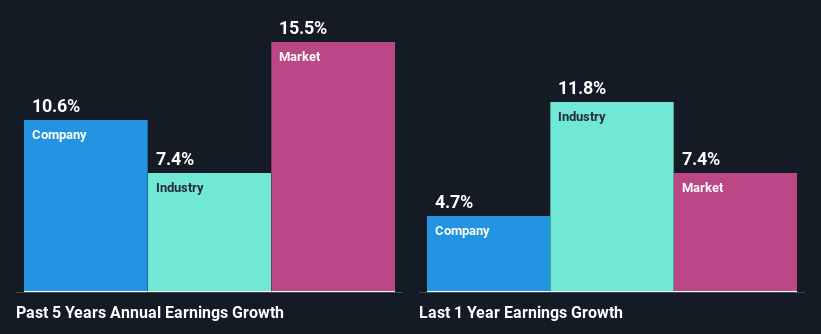
To begin with, Graco has a pretty high ROE which is interesting. Secondly, even when compared to the industry average of 13% the company's ROE is quite impressive. Probably as a result of this, Graco was able to see a decent net income growth of 11% over the last five years.
We then compared Graco's net income growth with the industry and we're pleased to see that the company's growth figure is higher when compared with the industry which has a growth rate of 7.4% in the same period.
Earnings growth is an important metric to consider when valuing a stock. What investors need to determine next is if the expected earnings growth, or the lack of it, is already built into the share price. Doing so will help them establish if the stock's future looks promising or ominous. Is GGG fairly valued? This infographic on the company's intrinsic value has everything you need to know.
Is Graco Using Its Retained Earnings Effectively?
Graco has a healthy combination of a moderate three-year median payout ratio of 32% (or a retention ratio of 68%) and a respectable amount of growth in earnings as we saw above, meaning that the company has been making efficient use of its profits.
Additionally, Graco has paid dividends over a period of at least ten years which means that the company is pretty serious about sharing its profits with shareholders. Our latest analyst data shows that the future payout ratio of the company over the next three years is expected to be approximately 31%. Accordingly, forecasts suggest that Graco's future ROE will be 23% which is again, similar to the current ROE.
Conclusion
Overall, we are quite pleased with Graco's performance. In particular, it's great to see that the company is investing heavily into its business and along with a high rate of return, that has resulted in a sizeable growth in its earnings. That being so, a study of the latest analyst forecasts show that the company is expected to see a slowdown in its future earnings growth. Are these analysts expectations based on the broad expectations for the industry, or on the company's fundamentals? Click here to be taken to our analyst's forecasts page for the company.
Have feedback on this article? Concerned about the content? Get in touch with us directly. Alternatively, email editorial-team (at) simplywallst.com.
This article by Simply Wall St is general in nature. We provide commentary based on historical data and analyst forecasts only using an unbiased methodology and our articles are not intended to be financial advice. It does not constitute a recommendation to buy or sell any stock, and does not take account of your objectives, or your financial situation. We aim to bring you long-term focused analysis driven by fundamental data. Note that our analysis may not factor in the latest price-sensitive company announcements or qualitative material. Simply Wall St has no position in any stocks mentioned.
Join A Paid User Research Session
You’ll receive a US$30 Amazon Gift card for 1 hour of your time while helping us build better investing tools for the individual investors like yourself. Sign up here
