
 Yahoo Finance
 Should GPT Group (ASX:GPT) Be Disappointed With Their 64% Profit?

Want to participate in a research study? Help shape the future of investing tools and earn a $60 gift card!
Generally speaking the aim of active stock picking is to find companies that provide returns that are superior to the market average. And while active stock picking involves risks (and requires diversification) it can also provide excess returns. For example, long term GPT Group (ASX:GPT) shareholders have enjoyed a 64% share price rise over the last half decade, well in excess of the market return of around 5.3% (not including dividends). On the other hand, the more recent gains haven't been so impressive, with shareholders gaining just 36%, including dividends.
See our latest analysis for GPT Group
While markets are a powerful pricing mechanism, share prices reflect investor sentiment, not just underlying business performance. By comparing earnings per share (EPS) and share price changes over time, we can get a feel for how investor attitudes to a company have morphed over time.
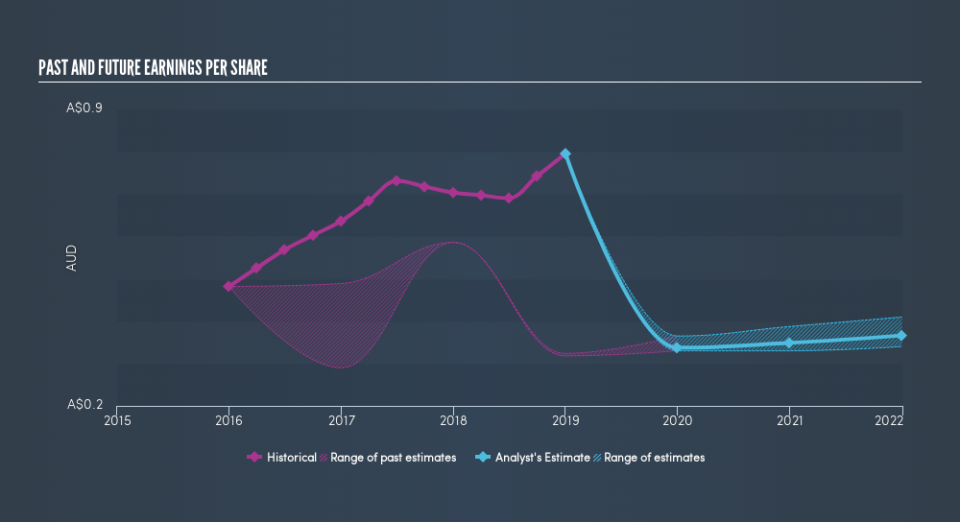
Over half a decade, GPT Group managed to grow its earnings per share at 21% a year. This EPS growth is higher than the 10% average annual increase in the share price. Therefore, it seems the market has become relatively pessimistic about the company. The reasonably low P/E ratio of 7.66 also suggests market apprehension.
The company's earnings per share (over time) is depicted in the image below (click to see the exact numbers).
We know that GPT Group has improved its bottom line lately, but is it going to grow revenue? You could check out this free report showing analyst revenue forecasts.
What About Dividends?
When looking at investment returns, it is important to consider the difference between total shareholder return (TSR) and share price return. The TSR incorporates the value of any spin-offs or discounted capital raisings, along with any dividends, based on the assumption that the dividends are reinvested. Arguably, the TSR gives a more comprehensive picture of the return generated by a stock. In the case of GPT Group, it has a TSR of 109% for the last 5 years. That exceeds its share price return that we previously mentioned. And there's no prize for guessing that the dividend payments largely explain the divergence!
A Different Perspective
It's good to see that GPT Group has rewarded shareholders with a total shareholder return of 36% in the last twelve months. Of course, that includes the dividend. That gain is better than the annual TSR over five years, which is 16%. Therefore it seems like sentiment around the company has been positive lately. Someone with an optimistic perspective could view the recent improvement in TSR as indicating that the business itself is getting better with time. Most investors take the time to check the data on insider transactions. You can click here to see if insiders have been buying or selling.
If you would prefer to check out another company -- one with potentially superior financials -- then do not miss this free list of companies that have proven they can grow earnings.
Please note, the market returns quoted in this article reflect the market weighted average returns of stocks that currently trade on AU exchanges.
We aim to bring you long-term focused research analysis driven by fundamental data. Note that our analysis may not factor in the latest price-sensitive company announcements or qualitative material.
If you spot an error that warrants correction, please contact the editor at editorial-team@simplywallst.com. This article by Simply Wall St is general in nature. It does not constitute a recommendation to buy or sell any stock, and does not take account of your objectives, or your financial situation. Simply Wall St has no position in the stocks mentioned. Thank you for reading.
