
 Yahoo Finance
 Goldman (GS) Q3 Earnings Miss, Revenues & Costs Disappoint
Goldman Sachs’ GS third-quarter 2019 results posted a negative earnings surprise of 4.8%. The company reported earnings per share of $4.79, missing the Zacks Consensus Estimate of $5.03. Further, the bottom-line figure compares unfavorably with earnings of $6.28 per share recorded in the year-earlier quarter.
The stock declined more than 1.5% in pre-market trading, reflecting investors’ disappointment with the results. Notably, the full-day trading session will depict a clearer picture.
The investment bank disappointed with its lower financial advisory and underwriting revenues. Also, lower investing and lending revenues was on the downside. Additionally, rise in expenses was a major drag. However, higher Fixed Income, Currency and Commodities Client Execution (FICC) revenues provided some respite.
Notably, high levels client activity was on the upside in the reported quarter.
Revenues Decline, Expenses Up
Goldman’s net revenues were down 6% year over year to $8.3 billion in the reported quarter. The revenue figure also lagged the Zacks Consensus Estimate of $8.6 billion.
Quarterly revenues, as per business segments, are as follows:
The Institutional Client Services division recorded revenues of $3.3 billion, up 6% year over year. This upside indicates higher net revenues in Fixed Income, Currency and Commodities Client Execution (up 8% year over year), driven by elevated revenues from interest rate, mortgages, commodities and credit products. These were partly mitigated by lower revenues from currencies.
Furthermore, higher equities revenues (up 5%), backed by stable equities client execution, elevated commissions and fees (up 8%) and securities service revenues (up 7%), were on the upside.
The Investment Management division recorded revenues of $1.7 billion, down 2% year over year. This downside mainly stemmed from lower transaction and incentive fees, partly offset by higher management and other fees.
The Investment Banking division generated revenues of around $1.7 billion, down 15% year over year. Results suggest decreased financial advisory revenues (down 22%) which reflects decline in industry-wide completed mergers and acquisition activities. Furthermore, lower underwriting revenues (down 9%), aided by reduced equity and debt underwriting revenues, were recorded.
The Investing and Lending division’s revenues of $1.7 billion in the September-end quarter came in 17% lower year over year. Decreased revenues from investments in equities, as well as debt securities & loans resulted in this downside.
Total operating expenses flared up around 1% year over year at $5.6 billion. Rise in almost all components of expenses, partly offset by lower compensation and benefits and other expenses led to the increase.
Notably, lower net provisions for litigation and regulatory proceedings were recorded.
Provision for credit losses was $291 million in the third quarter, up 67% year over year. Higher provisions are related to rise in impairments.
Strong Capital Position
Goldman displayed a robust capital position in the reported quarter. As of Sep 30, 2019, the company’s Common Equity Tier 1 ratio was 13.4% under the Basel III Advanced Approach, highlighting valid transitional provisions. The figure was up from the prior quarter’s 13.5%.
The company’s supplementary leverage ratio, on a fully phased-in basis, was 6.2% at the end of the July-September quarter, down from 6.4% in the previous quarter.
Return on average common shareholders’ equity, on an annualized basis, was 9% in the quarter.
Capital Deployment Update
During third-quarter 2019, the company repurchased 3.1 million shares of its common stock at an average price per share of $217.66 and a total cost of $1.14 billion, and paid around $466 million of common stock dividends.
Conclusion
Results of Goldman highlight a disappointing quarter. Downtrend in investing and lending business, along with lower underwriting and financial advisory revenues, are likely to impede revenue growth. Nonetheless, higher client activity leading to solid trading activities remains on the upside. Also, the company’s well-diversified business, apart from its core investment banking operations, continues to ensure earnings stability.
Its focus to capitalize on new growth opportunities through several strategic investments, including the digital consumer lending platform, will likely bolster overall business growth. Nonetheless, costs rising from technology investments and market development remain near- to medium-term headwinds.
The Goldman Sachs Group, Inc. Price, Consensus and EPS Surprise
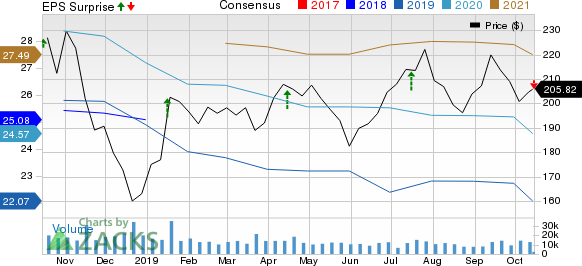
The Goldman Sachs Group, Inc. price-consensus-eps-surprise-chart | The Goldman Sachs Group, Inc. Quote
Currently, Goldman carries a Zacks Rank #3 (Hold). You can see the complete list of today’s Zacks #1 Rank (Strong Buy) stocks here.
Among other mega banks, Bank of America Corporation BAC and U.S. Bancorp USB are scheduled to report their quarterly numbers on Oct 16, while Morgan Stanley MS will report on Oct 17.
Today's Best Stocks from Zacks
Would you like to see the updated picks from our best market-beating strategies? From 2017 through 2018, while the S&P 500 gained +15.8%, five of our screens returned +38.0%, +61.3%, +61.6%, +68.1%, and +98.3%.
This outperformance has not just been a recent phenomenon. From 2000 – 2018, while the S&P averaged +4.8% per year, our top strategies averaged up to +56.2% per year.
See their latest picks free >>
Want the latest recommendations from Zacks Investment Research? Today, you can download 7 Best Stocks for the Next 30 Days. Click to get this free report
Bank of America Corporation (BAC) : Free Stock Analysis Report
U.S. Bancorp (USB) : Free Stock Analysis Report
Morgan Stanley (MS) : Free Stock Analysis Report
The Goldman Sachs Group, Inc. (GS) : Free Stock Analysis Report
To read this article on Zacks.com click here.
Zacks Investment Research
