
 Yahoo Finance
 Gold Price Futures (GC) Technical Analysis – November 14, 2017 Forecast
December Comex Gold futures are trading lower shortly before the opening, but recovering nicely from an early session set-back. After spiking to the downside earlier in the session, buyers are close to turning gold positive for the session in reaction to a stronger Euro and weaker U.S. Dollar.
Daily Technical Analysis
The main trend is down according to the daily swing chart. However, the market has been rangebound since late September.
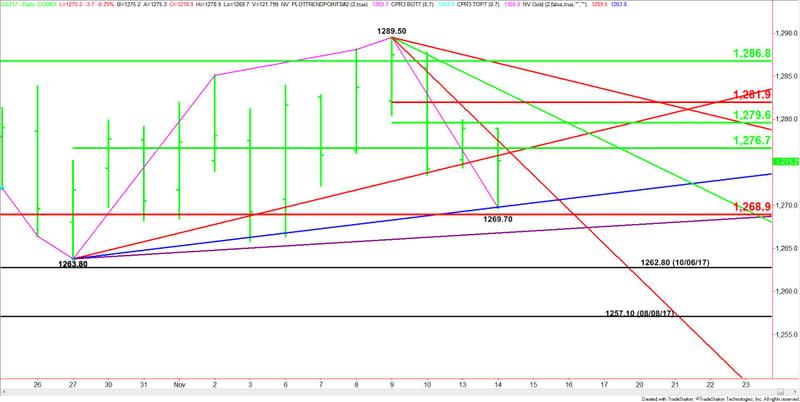
A trade through $1263.80 will signal a resumption of the downtrend. This is followed closely by the October 6 main bottom at $1262.80 and the August 8 main bottom at $1257.10.
The main trend will change to up on a trade through $1289.50.

Daily Technical Forecast
Based on the current price at $1275.20, the direction of the gold market the rest of the session will be determined by whether buyers can overcome a key resistance cluster at $1275.80 to $1277.50.
A sustained move under $1275.80 will indicate the presence of sellers. If this begins to generate enough downside pressure, we could see a retest of today’s support angle at $1269.80.
A sustained move over $1277.50 will signal the presence of buyers. This could trigger a breakout to the upside with the first target a 50% level at $1279.60, followed by a Fibonacci level at $1281.90 and a downtrending angle at $1283.50.
This article was originally posted on FX Empire
