Gold Price Futures (GC) Technical Analysis – Plenty of Room to Downside, but Also Ripe for Reversal Bottom
Support for gold continued to erode on Monday with the market falling to another three-month low, following last week’s dismal performance. Even with the Treasury markets closed and yields on hold during a U.S. bank holiday, gold couldn’t attract enough buyers to sustain an early attempt to rally the beat-up, so-called safe-haven asset.
On Monday, December Comex gold futures settled at $1457.10, down $5.80 or -0.40%.
Time for gold bugs to face the facts, the precious metal is an investment, not a safe-haven asset. And right now this non-yielding, non-dividend paying investment can’t compete with the return offered by Treasurys and the stock market.

Daily Swing Chart Technical Analysis
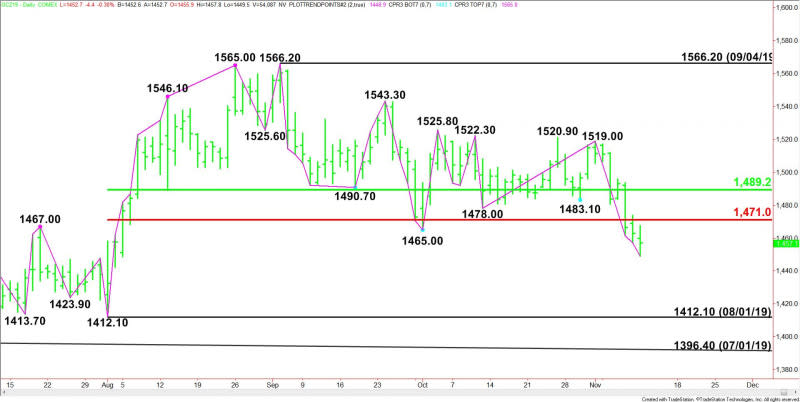
The main trend is down according to the daily swing chart. The nearest downside target is the August 1 swing bottom at $1412.10. The main trend will change to up if buyers can take out $1519.00. This is highly unlikely on Tuesday, but due to the 7 to 10 day rule, traders should be on alert for a closing price reversal bottom.
The main range is $1412.10 to $1566.20. Its retracement zone at $1471.00 to $1489.20 is potential resistance. The area is controlling the near-term direction of the market.
Daily Swing Chart Technical Forecast
The direction of the December Comex gold futures contract on Tuesday is likely to be determined by trader reaction to Monday’s close at $1457.10.
Bearish Scenario
A sustained move under $1457.10 will indicate the presence of sellers. This move is likely to continue to generate the downside momentum needed to eventually challenge the August 1 bottom at $1412.10.
Bullish Scenario
Overtaking and sustaining a rally over $1457.10 will signal the presence of buyers. This could set up a 2 to 3 day counter-trend rally with potential upside targets the main Fibonacci level at $1471.00 and the main 50% level at $1489.20. Sellers are likely to re-emerge on a test of $1471.00 to $1489.20.
This article was originally posted on FX Empire

 Yahoo Finance