
 Yahoo Finance
 Gold Price Futures (GC) Technical Analysis – February 13, 2019 Forecast
Gold futures are edging higher on Wednesday. The market is being underpinned by the weaker U.S. Dollar, but gains are being capped by increased demand for risky assets and rising U.S. Treasury yields. The market is trading inside its previous two daily ranges. This tends to suggest investor indecision and impending volatility. The tighter they wind this market, the greater the breakout once it starts.
At 06:11 GMT, April Comex gold futures are trading $1316.70, up $2.70 or +0.21%.
Daily Technical Analysis
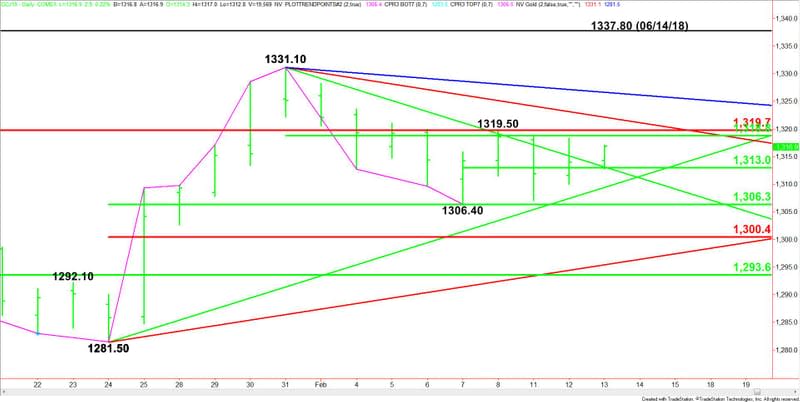
The main trend is up according to the daily swing chart. A trade through $1331.10 will signal a resumption of the uptrend. A move through $1281.50 will change the main trend to down.
The minor trend is also up. A move through $1306.40 will change the minor trend to down. This will also shift momentum to the downside. A trade through $1319.50 will reaffirm the minor uptrend.
The price action is also being influenced by a series of retracement levels.
The major retracement zone is $1293.60 to $1319.70. This zone is currently trading inside this range. It is controlling the longer-term direction of the market.
The main range is $1281.50 to $1331.10. Its retracement zone at $1306.30 to $1300.40 is the primary downside target and support.
The intermediate range is $1331.10 to $1306.40. Its 50% level or pivot at $1318.80 is resistance.
The short-term range is $1306.40 to $1319.50. Its 50% level or pivot at $1313.00 is support.
The best resistance is a price cluster at $1318.80 to $1319.70.
Daily Technical Forecast
Based on the early price action, the direction of the April Comex gold futures contract is likely to be determined by trader reaction to the support cluster at $1313.10 to $1313.00. This area provided support earlier in the session.
Bullish Scenario
A sustained move over $1313.10 will indicate the presence of buyers. If this move generates enough upside momentum then look for buyers to take a run at the cluster of levels at $1318.80, $1319.70 and $1319.50. We could see a technical bounce on the first test of this area.
Overtaking $1319.50 will indicate the buying is getting stronger. The first target angle comes in at $1322.10. Taking out this angle could trigger an acceleration into another angle at $1326.60. This is the last potential resistance angle before the $1331.10 main top.
Bearish Scenario
A sustained move under $1313.00 will signal the presence of sellers. This could trigger a break into the uptrending Gann angle at $1309.50. Since the trend is up, look for buyers to come in on the first test of this angle. If it fails then look for the selling to possibly extend into the support cluster formed by the minor bottom at $1306.40, followed by the 50% level at $1306.30. The latter is a potential trigger point for an acceleration into $1300.40.
Please let us know what you think in the comments below.
This article was originally posted on FX Empire
More From FXEMPIRE:
GBP/USD Price Forecast – British Pound To Trade Range Bound Ahead of UK CPI Update
E-mini NASDAQ-100 Index (NQ) Futures Technical Analysis – February 13, 2019 Forecast
USD/JPY Fundamental Daily Forecast – Widening Interest Rate Differential Supporting U.S. Dollar
Dax Index Daily Price Forecast – Dax To Trade Positive On Strong Fundamentals
AUD/USD Forex Technical Analysis – February 13, 2019 Forecast
