
 Yahoo Finance
 Gold and Crude Oil Still Range-Bound as SPX 500 Recovers
DailyFX.com -
Talking Points:
US Dollar Holds at Range Floor, Attempts to Recover
S&P 500 Continues to Correct, Reclaims2100 Figure
Gold and Crude Oil Prices Remain in Digestion Mode
Can’t access the Dow Jones FXCM US Dollar Index? Try the USD basket on Mirror Trader. **
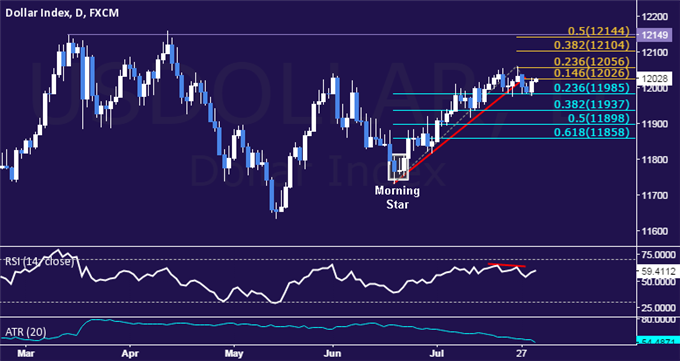
US DOLLAR TECHNICAL ANALYSIS – Prices areattempting to rebuild upside momentum after finding range bottom support. Near-term resistance is at 12026, the 14.6% Fibonacci expansion, with a break above that on a daily closing basis exposing the 23.6% level at 12056. Alternatively, a reversal below the 23.6% Fib retracement at 11985 opens the door for a challenge of the 38.2% threshold at 11937.
** The Dow Jones FXCM US Dollar Index and the Mirror Trader USD basket are not the same product.
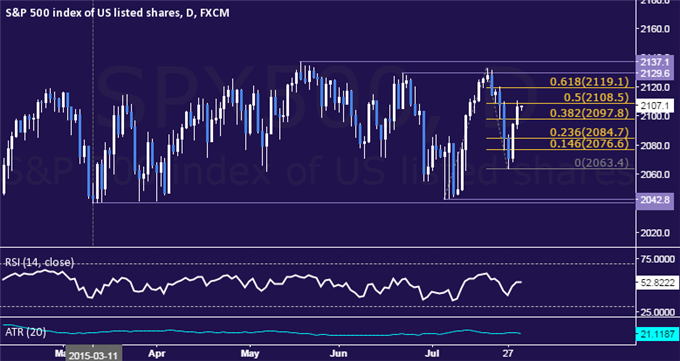
S&P 500 TECHNICAL ANALYSIS – Prices continue to correct higher following a sharp three-day loss streak. A break above the 50% Fibonacci expansion at 2108.50 exposes the 61.8% level at 2119.10. Alternatively, a move below the 38.2% Fib at 2097.80 targets the 23.6% expansion at 2084.70.
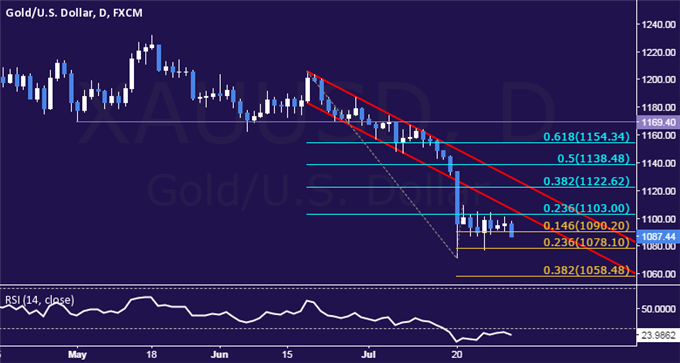
GOLD TECHNICAL ANALYSIS – Prices continue to consolidate after falling to the weakest level in over five years. A break below the 14.6% Fibonacci expansion at 1090.20 exposes the 23.6% level at 10778.10. Alternatively, a move above the 23.6% Fib retracement at 1103.00 targets channel floor support-turned-resistance at 1109.21.
CRUDE OIL TECHNICAL ANALYSIS – Prices remain in digestion mode after hitting a five-month low. A daily close below the 50% Fibonacci expansion at 52.37 exposes the 61.8% level at 50.66. Alternatively, a reversal above the 38.2% Fib at 54.08 targets the 23.6% expansion at 56.20.

--- Written by Ilya Spivak, Currency Strategist for DailyFX.com
To receive Ilya's analysis directly via email, please SIGN UP HERE
Contact and follow Ilya on Twitter: @IlyaSpivak
DailyFX provides forex news and technical analysis on the trends that influence the global currency markets.
Learn forex trading with a free practice account and trading charts from FXCM.
