
 Yahoo Finance
 Gold Bouncing from Long Term Trendline
DailyFX.com -
Daily
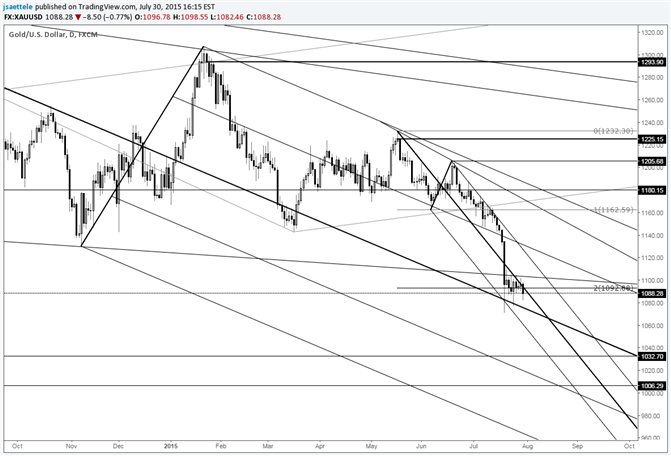
Chart Prepared by Jamie Saettele, CMT
Automate trades with Mirror Trader and see ideas on other USD crosses
-“Pay attention to RSI, which has been coiling since November. The length of the momentum coil indicates a great deal of stored energy and the potential for an explosive move.”
-“The latest attempt on the upside failed (RSI failed at its own trendline), which keeps the broader move sideways to down. Gold completed the head and shoulders pattern with the 7/15 close. Targets are 1093 and 1106.50. The breakdown is valid as long as price is below the 7/6 high of 1174.78.”
“The target has been reached. Gold may try and form an important low down here at a long term trendline.”
For more analysis and trade setups (exact entry and exit), visit SB Trade Desk
DailyFX provides forex news and technical analysis on the trends that influence the global currency markets.
Learn forex trading with a free practice account and trading charts from FXCM.
